🌍 Public
Fork of Stylized Line Chart
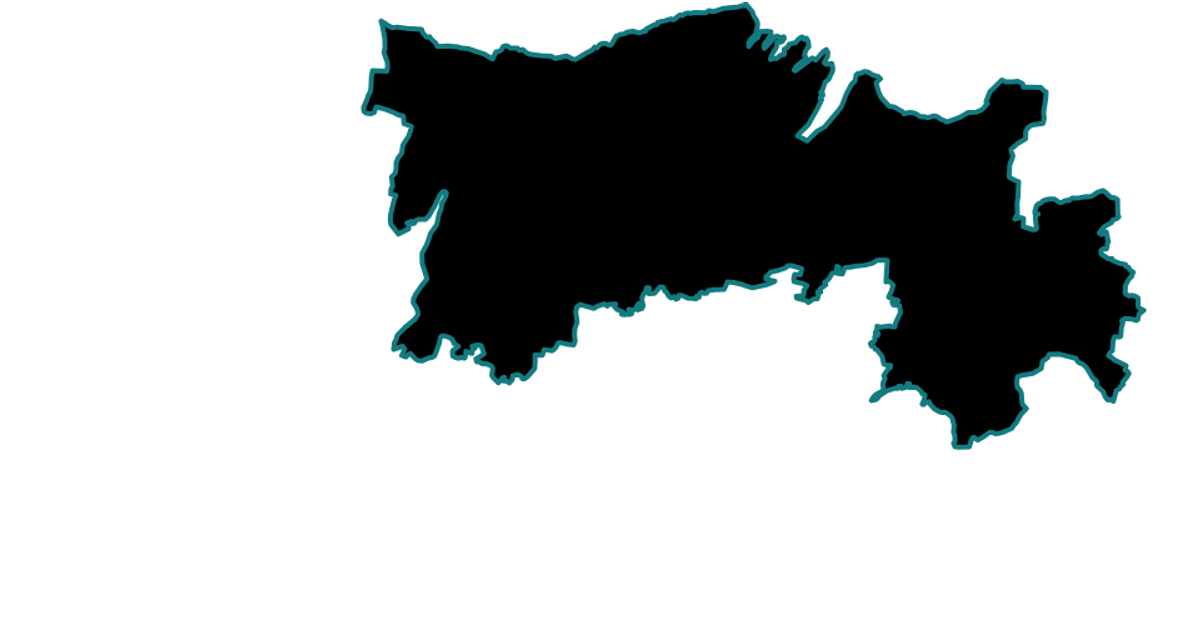
A choropleth map of Germany visualizes diesel prices by state using a yellow-orange-red sequential color scale. The map is rendered as SVG paths, with each region's fill color determined by the diesel value from a dataset of the German states. The D3.js library handles geographic projections via geoMercator and geoPath, while React manages the component state and data fetching via the csv and json API calls.
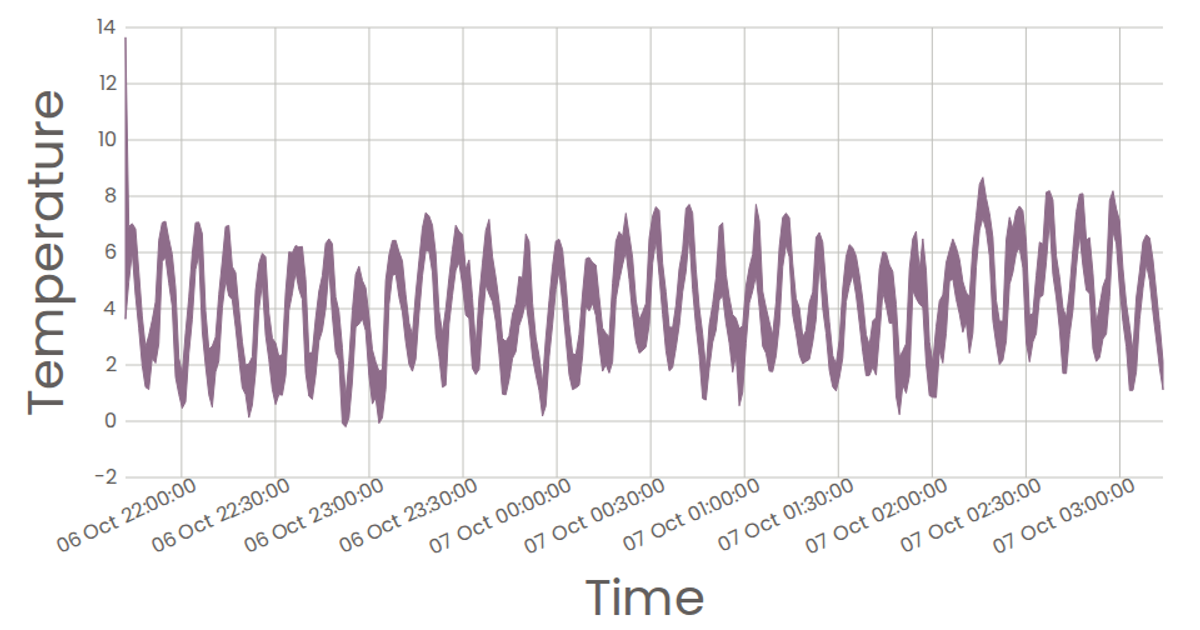
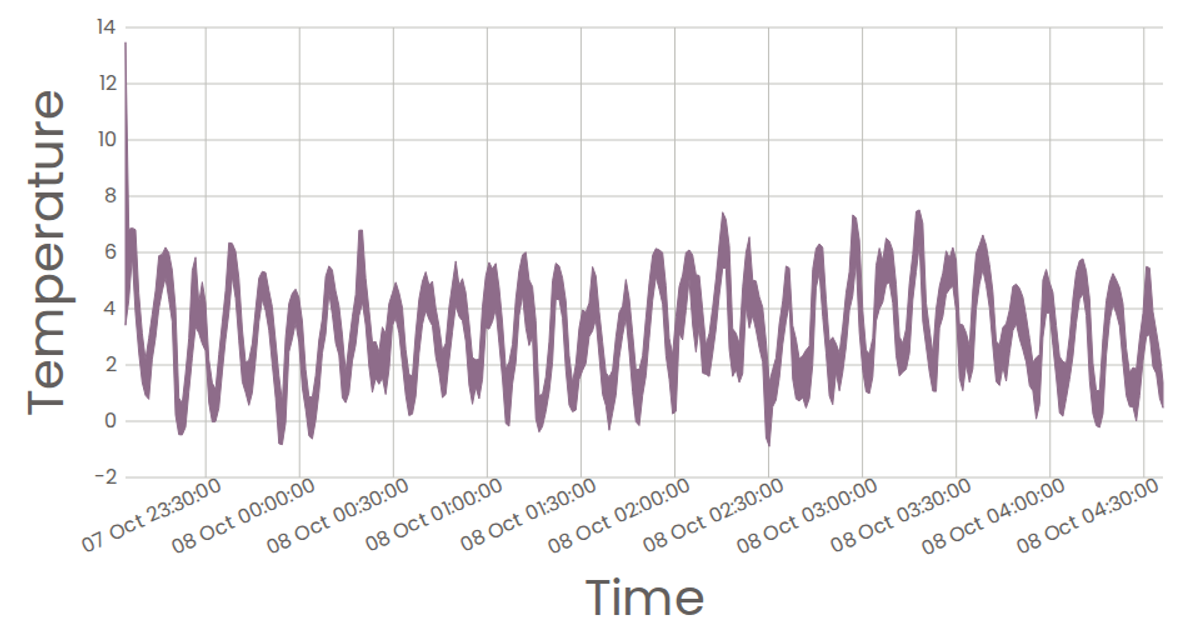
AI-generated descriptionA scatter plot of Data Canvas Sense Your City Dataset.
MIT Licensed




Comments
Sign in to join the discussion.