🌍 Public
Bar-Chart
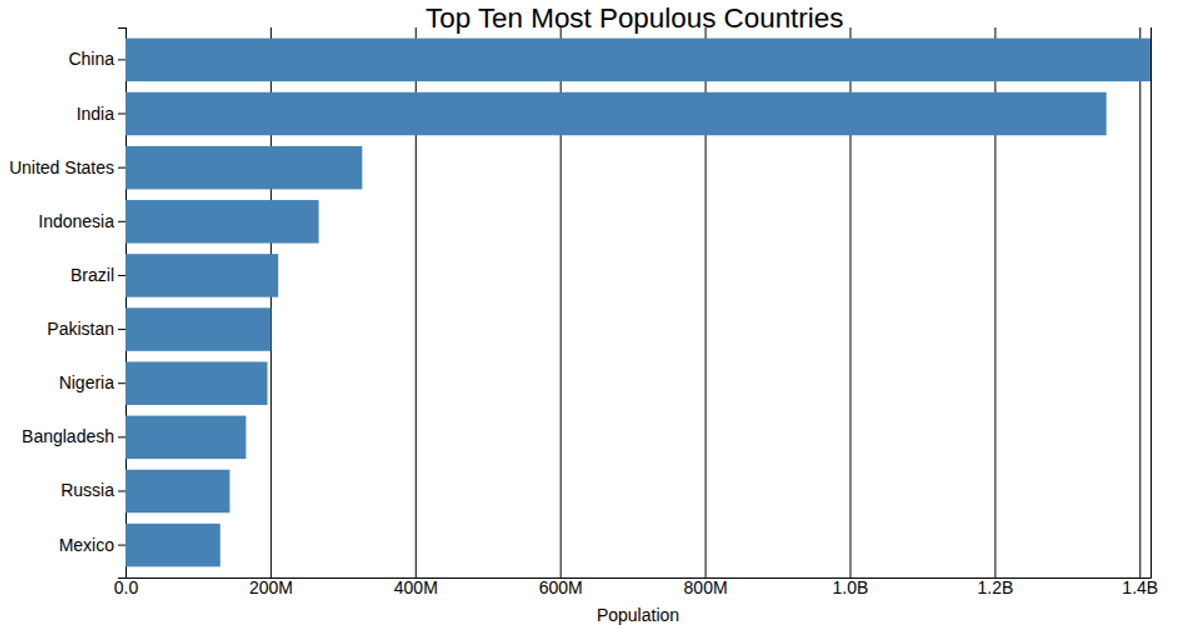
This bar chart visualizes the top 10 most populous countries as of January 1st, 2024, using horizontal bars to compare population sizes. It loads data from an ICRISAT CSV file and processes it with D3.js, mapping state names to rice yield values. The visualization uses `d3.scaleBand` and `d3.scaleLinear` for axes, with bars rendered as SVG rectangles. The code includes `d3.axisBottom` and `d3.axisLeft` for labeled axes, and leverages the `observeResize` API from `@drbagwell/responsive-viz-axes` to handle responsive sizing.
AI-generated descriptionA bar chart showing the top 10 most populous countries on Earth as of January 1st 2024.
Challenge
- Fork this viz and modify it to show your own data
MIT Licensed




Comments
Sign in to join the discussion.