🌍 Public
Let's make a face!
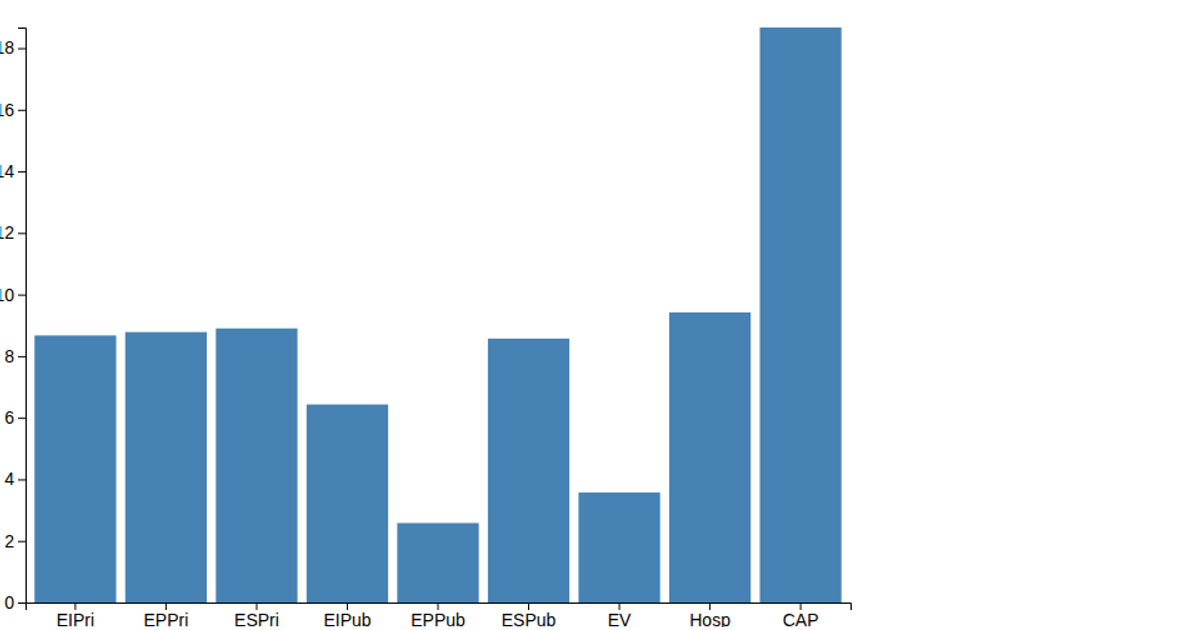
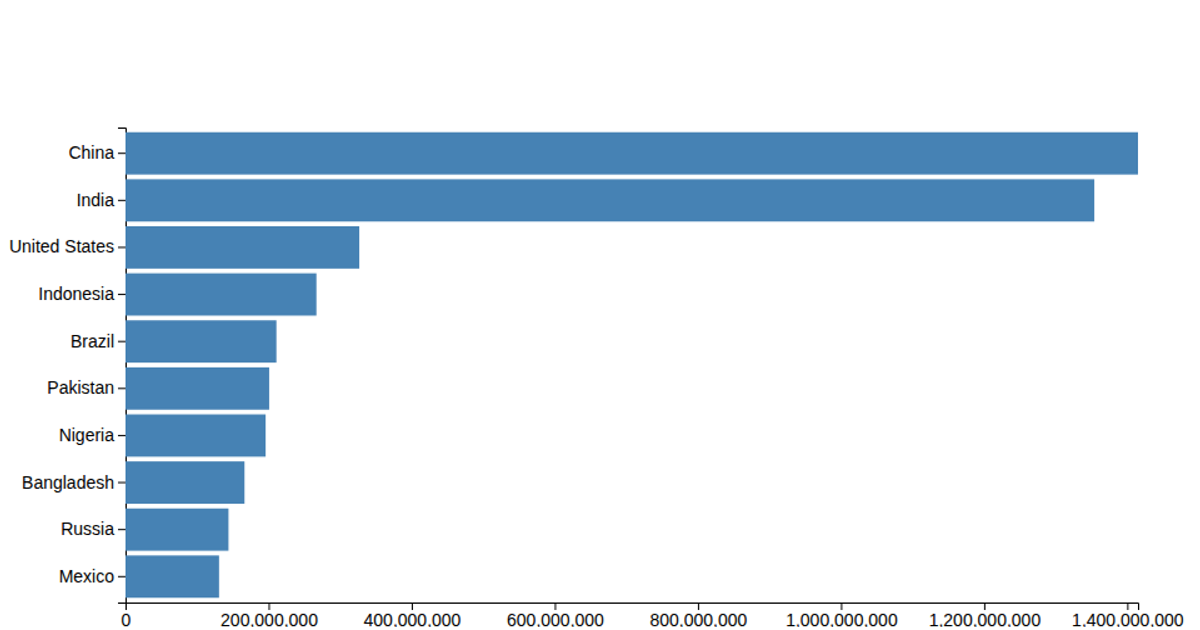
This example visualizes 13 days of data with a bar chart showing trends over time, using a date-based y-axis and a numeric x-axis. The bars are rendered as SVG rectangles filled with steelblue, driven by the `data.csv` file containing date, actual, and trend columns. The code builds the chart with d3.v6, React, and the `scaleLinear`, `scaleBand`, `axisLeft`, and `axisBottom` APIs, while `select` and `csv` handle DOM selection and data loading. The chart includes axes and margins, but the focus is on the clean, minimal bar representation.
AI-generated descriptionMaking shapes with HTML, CSS and SVG.
See also React Starter.
MIT Licensed




Comments
Sign in to join the discussion.