🌍 Public
Choropleth Map
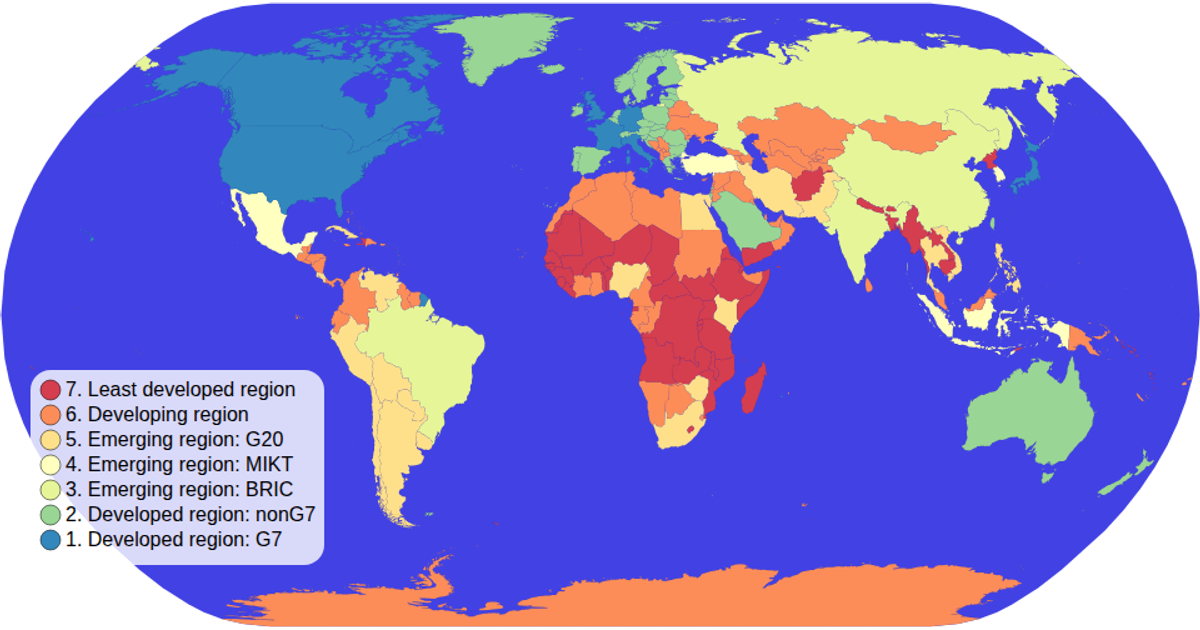
This choropleth map colors world countries by economic grouping, using a spectral color scale to distinguish categories. Built with D3 v5, it renders geographic boundaries as SVG paths via the `geoPath` projection. The visualization includes an interactive color legend generated with a custom `colorLegend` module, and supports zooming through D3's `zoom` event. Data merges TopoJSON country shapes with a TSV containing economy classifications from the world-atlas package.
AI-generated descriptionMIT Licensed




Comments
Sign in to join the discussion.