🌍 Public
Log Scale of Missing Migrants over Time
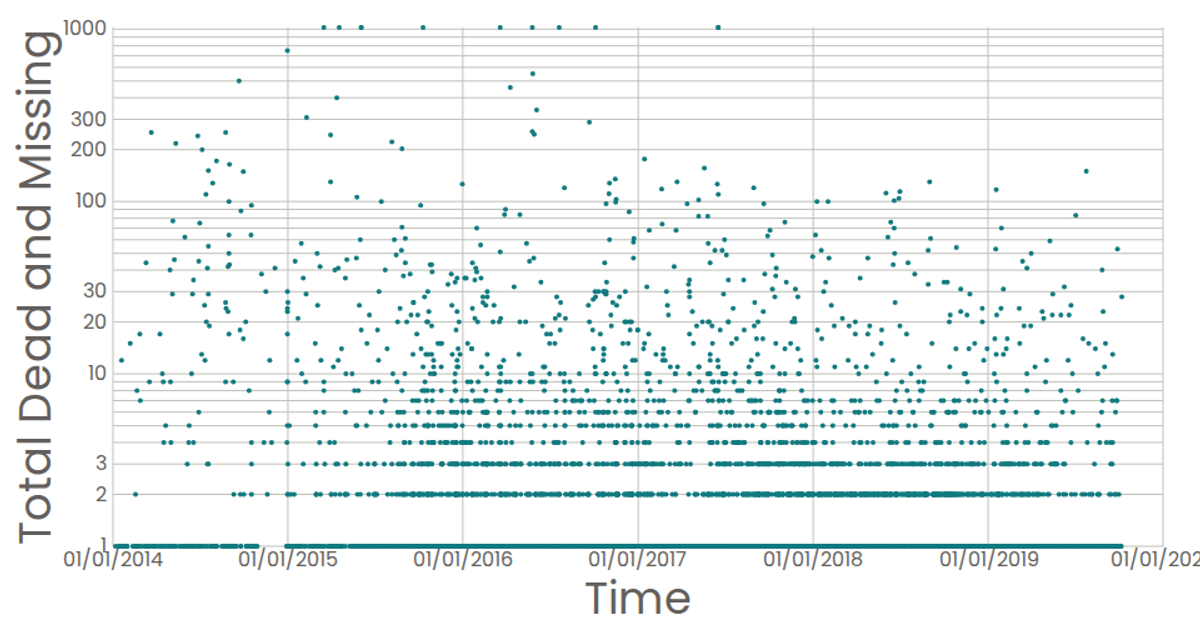
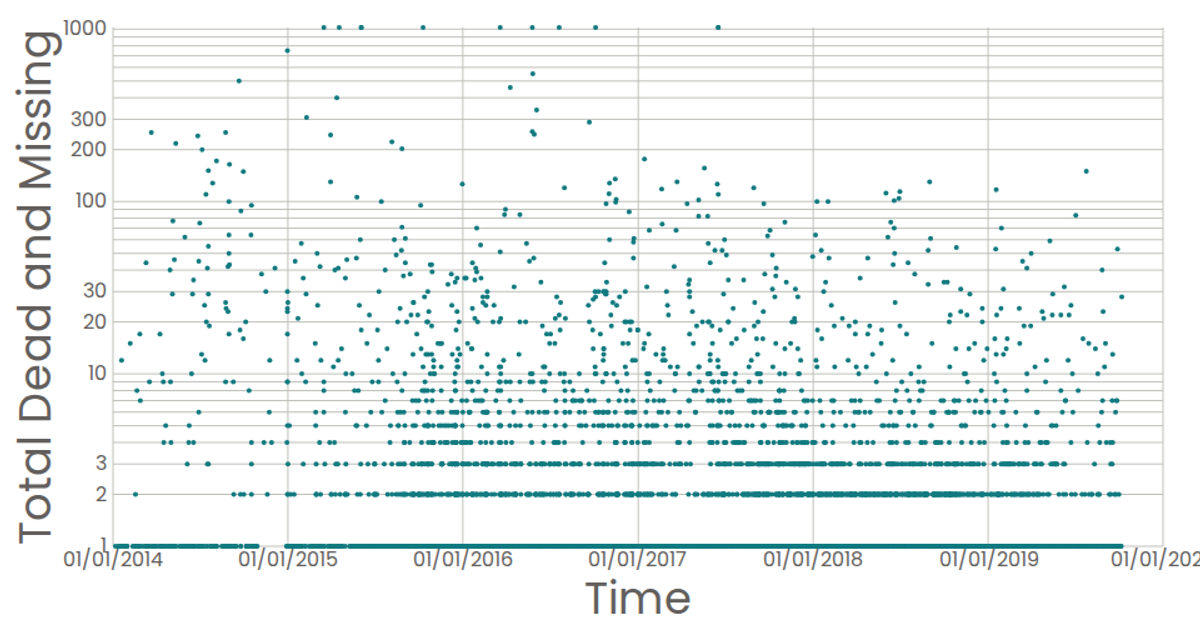
This scatter plot visualizes events from the Missing Migrants Dataset, showing the relationship between reported date and total dead or missing individuals. Each circle represents a single event, with time on the x-axis and a log-scaled y-axis to accommodate the wide range of values. The visualization uses D3 v5’s `scaleTime` and `scaleLog` for axis scaling, with React components rendering SVG marks, axes, and labels. Tooltips provide formatted date information on hover through SVG `<title>` elements.
AI-generated descriptionA scatter plot of the Missing Migrants Dataset.
Each point in the plot represents a single event.
MIT Licensed



Comments
Sign in to join the discussion.