🌍 Public
ice6
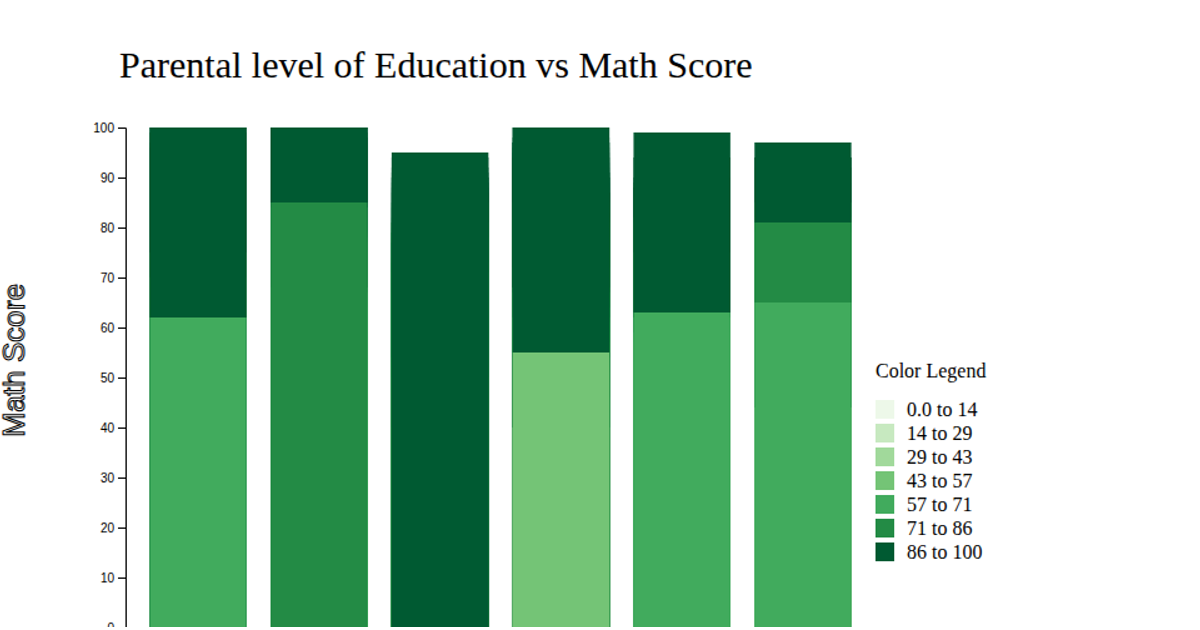
This visualization shows the effect of parental education level on students' math scores using a horizontal bar chart, with green rectangles encoding score magnitudes. The chart displays average math scores across different parental education categories, using a linear scale for the x-axis and a band scale for the y-axis. The code uses d3.csv to load the data, d3.scaleLinear and d3.scaleBand for scaling, and d3.axisLeft and d3.axisBottom for axes, rendering the visualization as SVG.
AI-generated descriptionMIT Licensed




Comments
Sign in to join the discussion.