🌍 Public
Let's make a map!
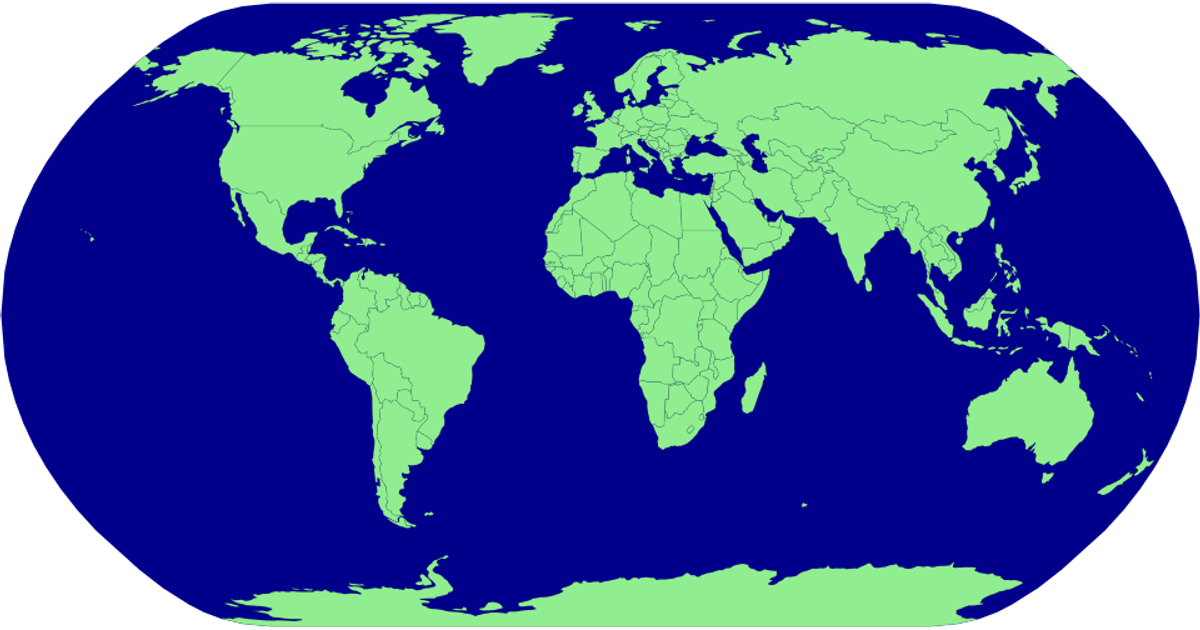
This map visualization displays countries as light green polygons with black outlines, set against a blue spherical background representing the globe. The example uses D3.js v5, specifically d3.geoPath and d3.geoNaturalEarth1 for the map projection, along with the TopoJSON library to convert geographic data into SVG paths. Country boundaries are rendered from the world-atlas countries-110m.json dataset, which is fetched and processed asynchronously. The visualization demonstrates a basic choropleth-free world map, focusing on geographical shape rendering rather than data encoding.
AI-generated descriptionMIT Licensed




Comments
Sign in to join the discussion.