🌍 Public
London Airbnb Person Cap vs Price w/ Color & Interaction
MMatt Hagger
Last edited Oct 29, 2025
Created on Oct 29, 2025
Forked from London Airbnb Person Cap vs Price w/ Color
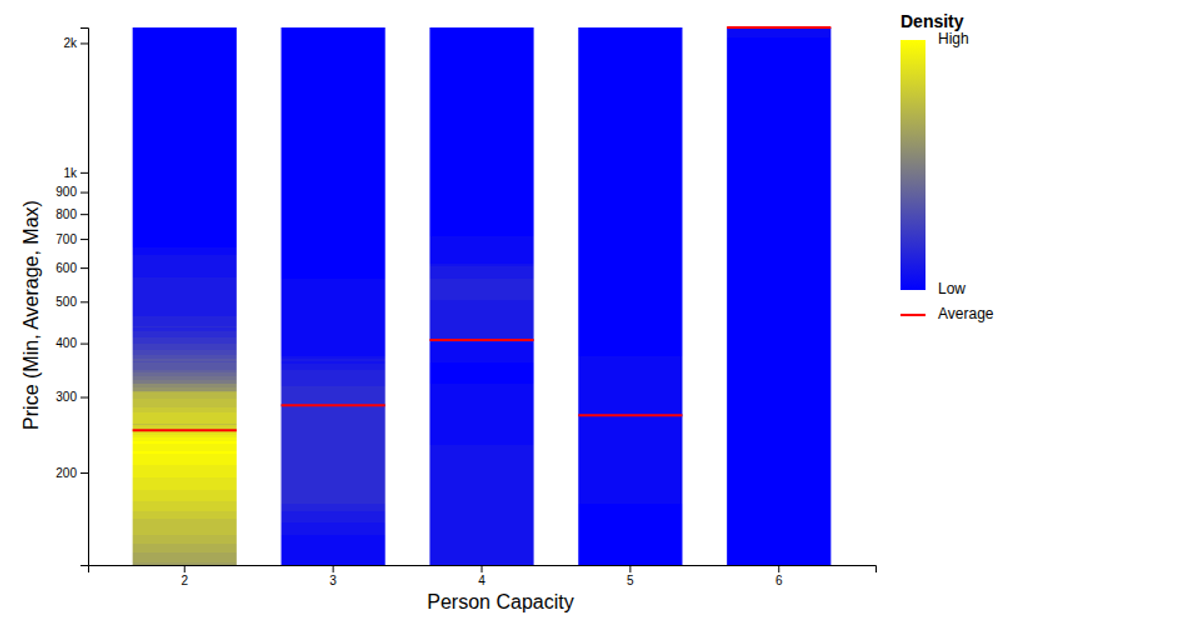
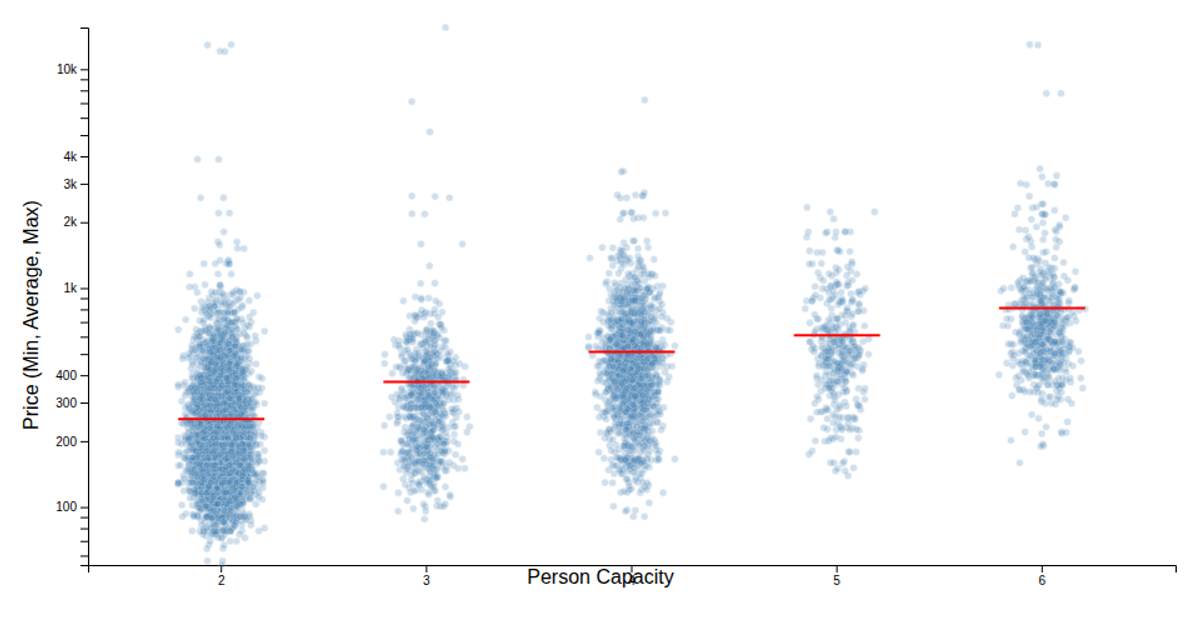
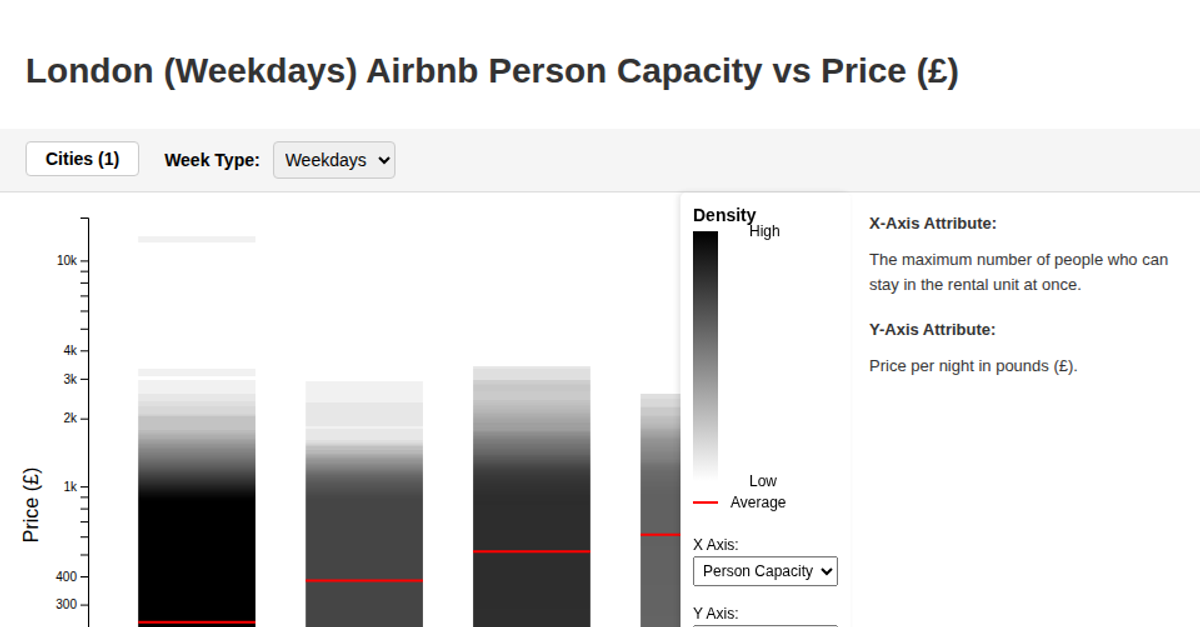
This interactive scatterplot visualization explores London Airbnb pricing by person capacity, with user-selectable X and Y axes from multiple numeric property columns. The chart renders a density heatmap background using d3.scaleLinear, d3.scaleBand, and d3.scaleLog, computing per-pixel point density across the plot area and coloring regions from blue to yellow based on concentration. A yellow-to-blue gradient legend displays density levels with a red line marking the average. Users can filter data by minimum value via a range slider tied to any selected numeric property, with all controls updating the React-rendered visualization in real time.
AI-generated descriptionMIT Licensed




Comments
Sign in to join the discussion.