🌍 Public
vizualization_vega-lite-api
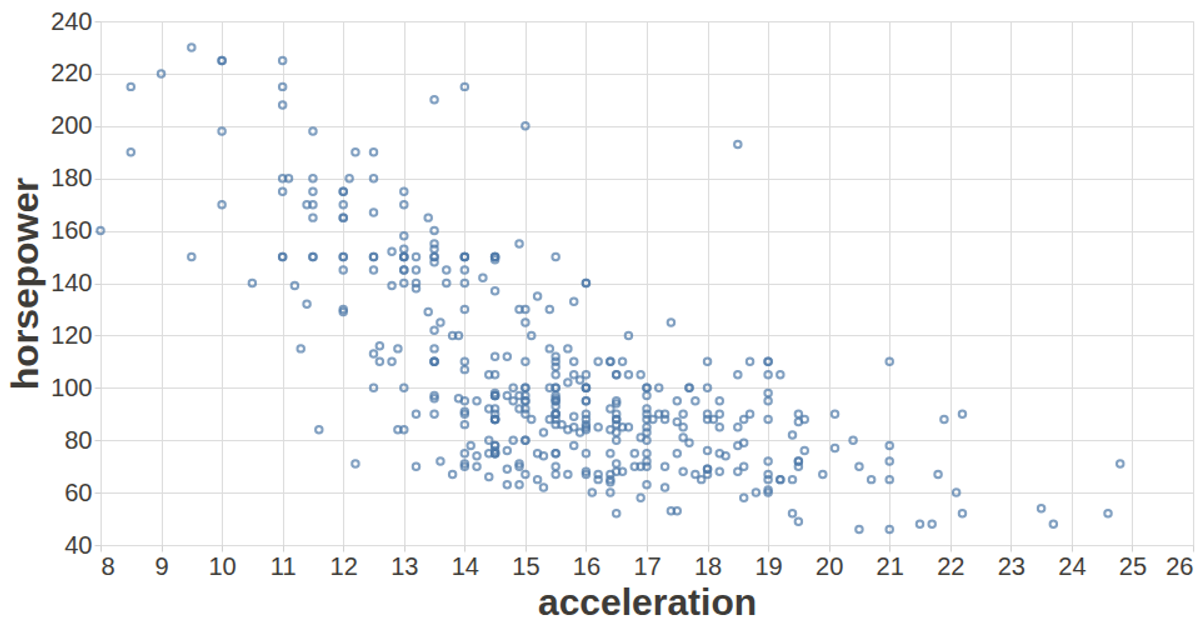
This example visualizes the relationship between acceleration and horsepower for automobile models, with a tooltip displaying the vehicle name on hover. The visualization is built using the Vega-Lite API, which is registered with Vega and Vega-Lite, and rendered as SVG within a React application. Data is loaded asynchronously from a CSV file using D3’s `csvParse`. The chart uses configurable axis and label styling, and employs a dark color scheme for text and tooltips.
AI-generated descriptionSmiley face implementation with React & D3.
MIT Licensed




Comments
Sign in to join the discussion.