🌍 Public
Bar Chart
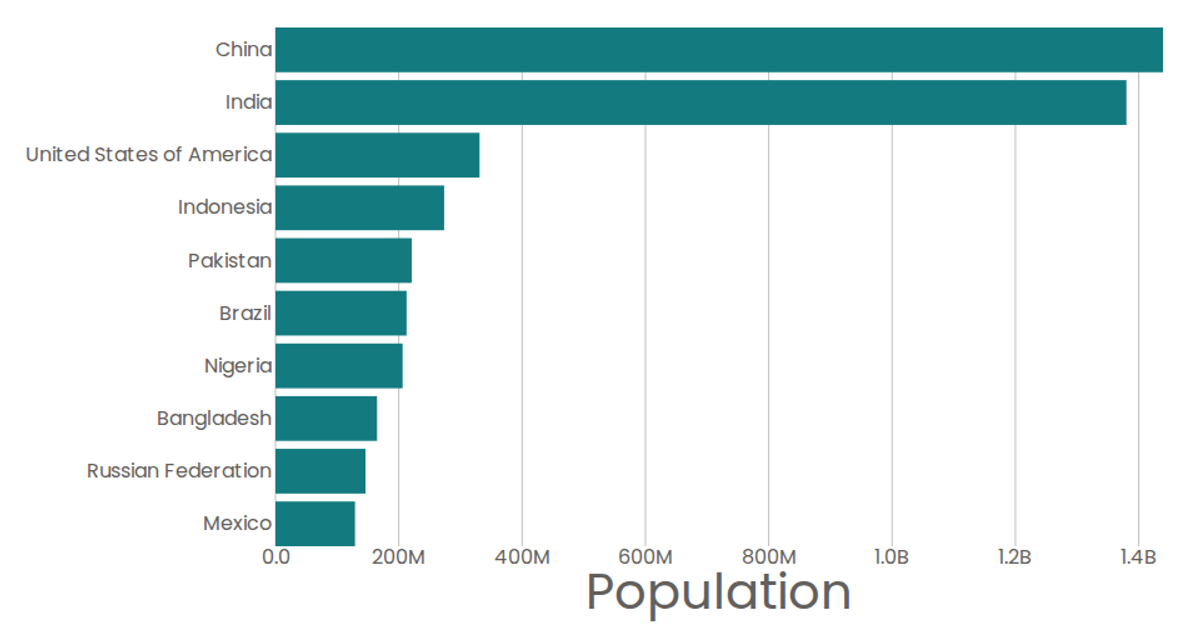
This bar chart displays the top 10 most populous countries for 2020, using horizontal bars without any axes or labels. The chart uses React with a `useState` hook and `useEffect` to load and parse data from a CSV file via D3’s `csv` function, then applies `scaleBand` and `scaleLinear` to map countries and populations to SVG rectangle positions and widths. Data comes from the United Nations World Population Prospects 2019 dataset.
AI-generated descriptionA program that shows the top 10 most populous countries as a bar chart with no axes.
MIT Licensed



Comments
Sign in to join the discussion.