BC Offsite Species
This visualization combines a bubble map with a linked time-series histogram to explore offsite species trial data. The map projects geographic coordinates using `d3.geoAlbers` and `d3.geoPath`, with circle sizes scaled by area via `d3.scaleSqrt`. A `d3.brushX` on the histogram filters the map’s displayed points by biogeoclimatic zone. Data comes from a CSV of BC offsite trials, rendered with React and D3 v5 using SVG.
AI-generated descriptionThe final installment from the online course Datavis 2020.
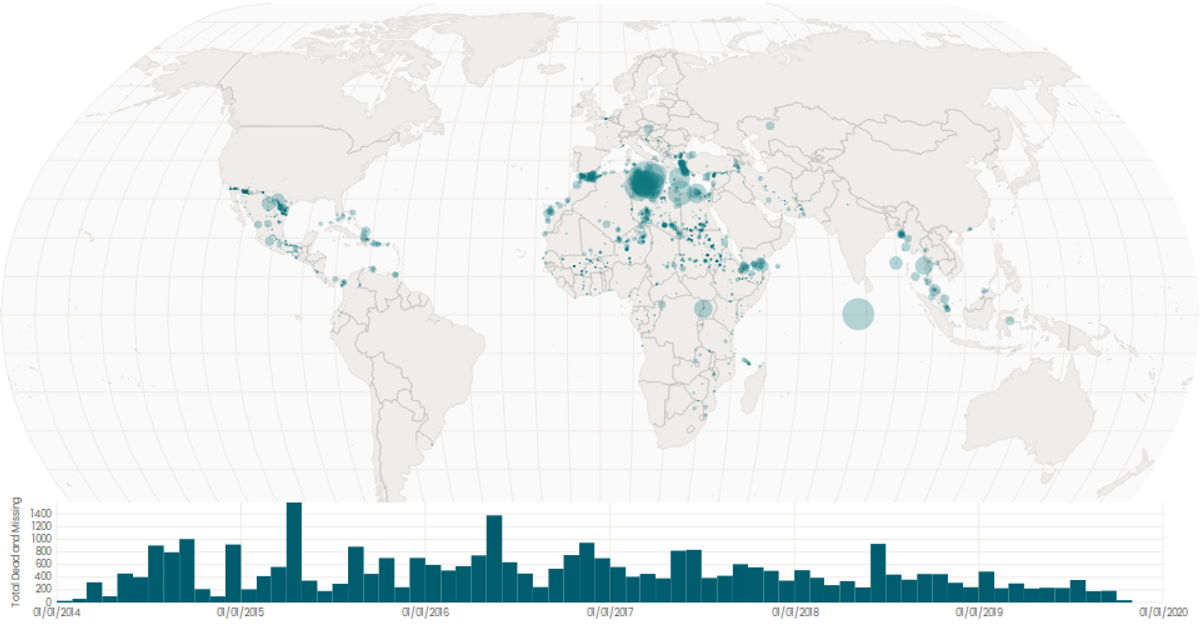
A world map showing cities with population greater than 50,000. City data from Simplemaps: World Cities Database.
Country boundaries from World Atlas TopoJSON, polished for visual style, including graticules.
This iteration is optimized for performance using React's useMemo hook.




Comments
Sign in to join the discussion.