🌍 Public
Fork of Activity7question1
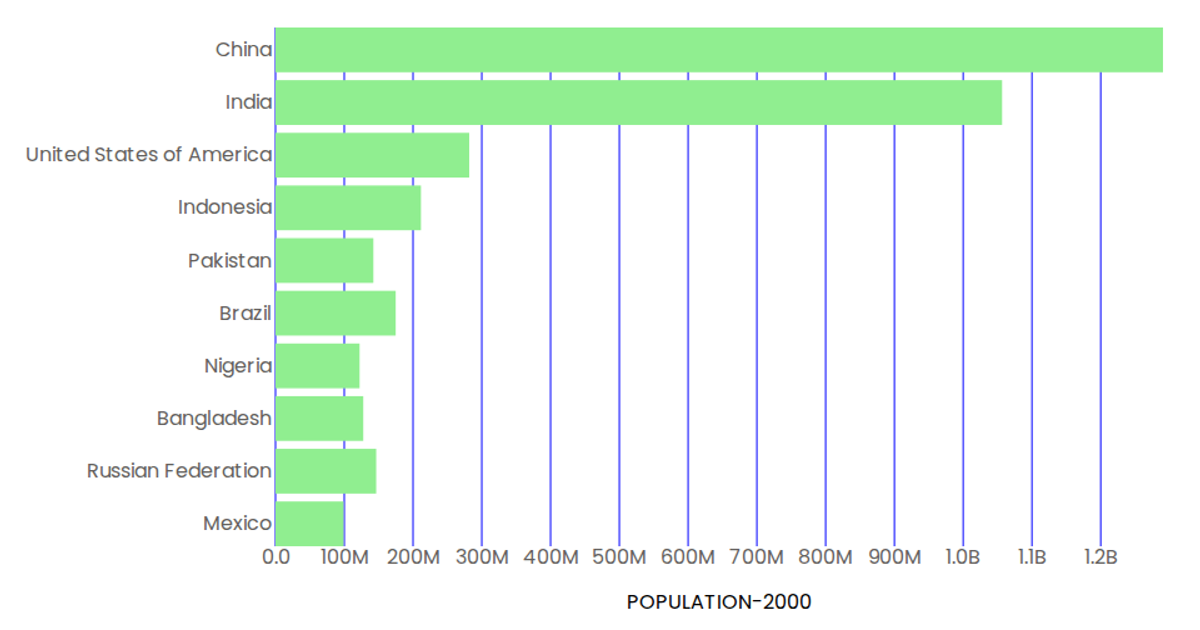
This example shows a horizontal bar chart ranking the populations of ten countries in the year 2000. The chart uses React with D3 v5, leveraging `scaleBand` and `scaleLinear` for positioning, while rendering SVG rectangles. Country names appear on the y-axis, and population values are formatted with D3’s `format` function, converting values to billions. Data is loaded asynchronously from a CSV file using `d3.csv`, and axes are drawn with custom React components, with tick lines highlighted in blue.
AI-generated descriptionA demonstration of how to start using D3 version 6.
MIT Licensed



Comments
Sign in to join the discussion.