🌍 Public
Q1_piechart
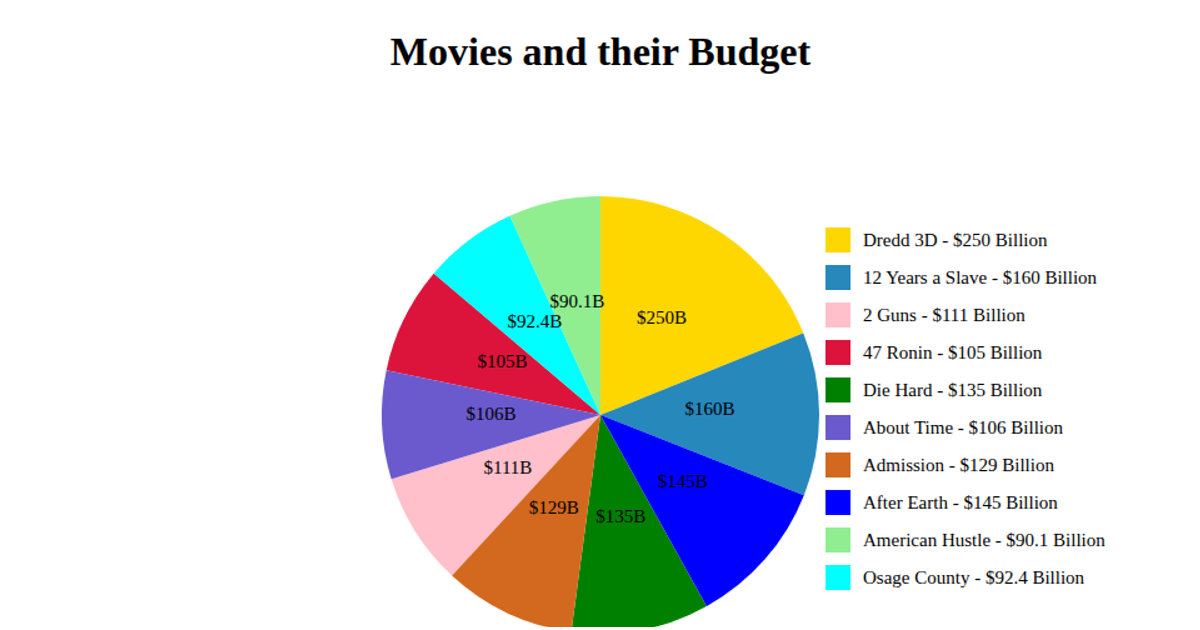
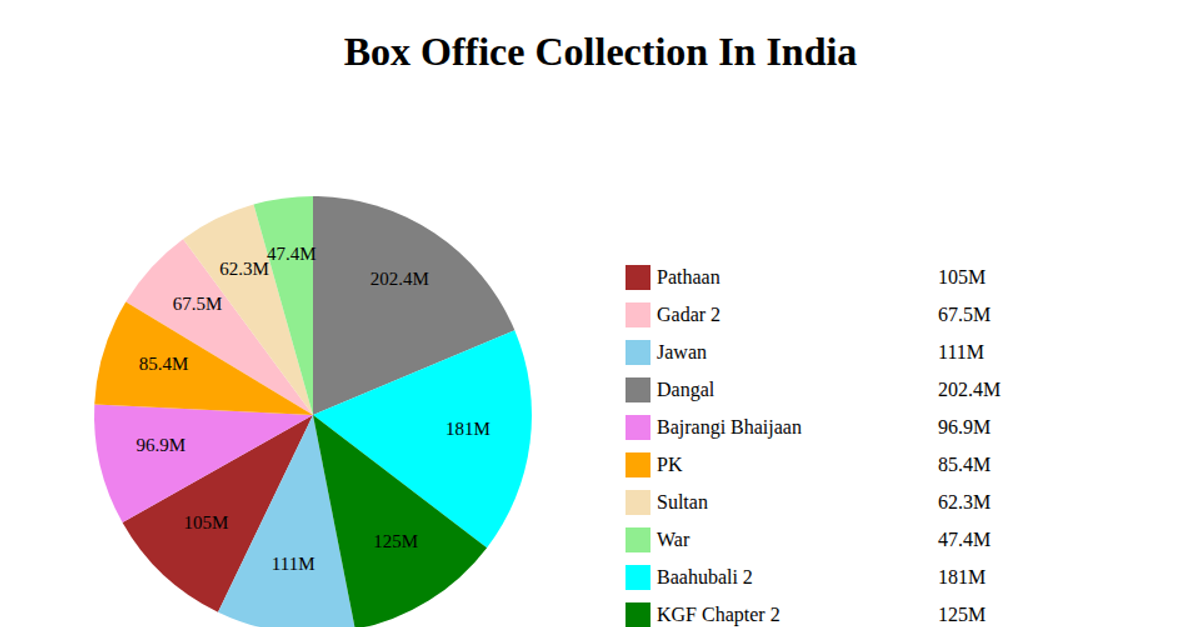
This pie chart visualizes the worldwide gross revenue of movies from a CSV dataset, with each slice representing a single film. Hovering over a slice reveals a tooltip showing the movie title and its exact box office earnings. The chart is built using D3.js v7, employing `d3.pie()` for the layout, `d3.arc()` for the slices, and `d3.scaleOrdinal` with a color scheme for differentiation. It also includes an interactive legend and axis labels, all rendered as SVG within an HTML page.
AI-generated descriptionMIT Licensed






Comments
Sign in to join the discussion.