🌍 Public
Fork of Activity6_Question2
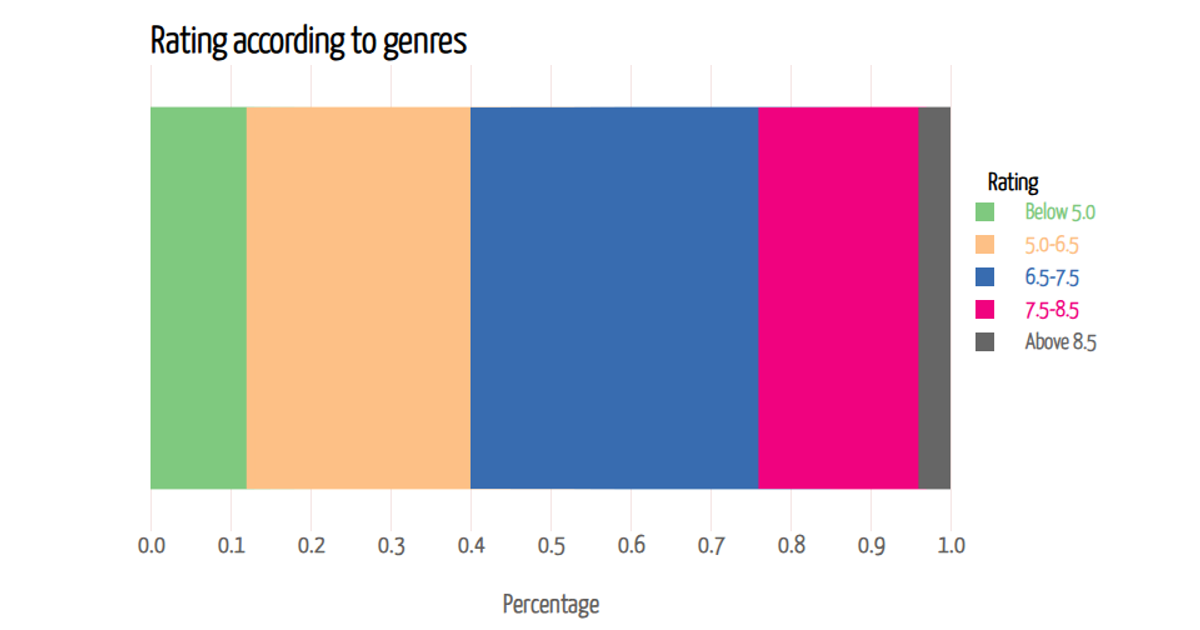
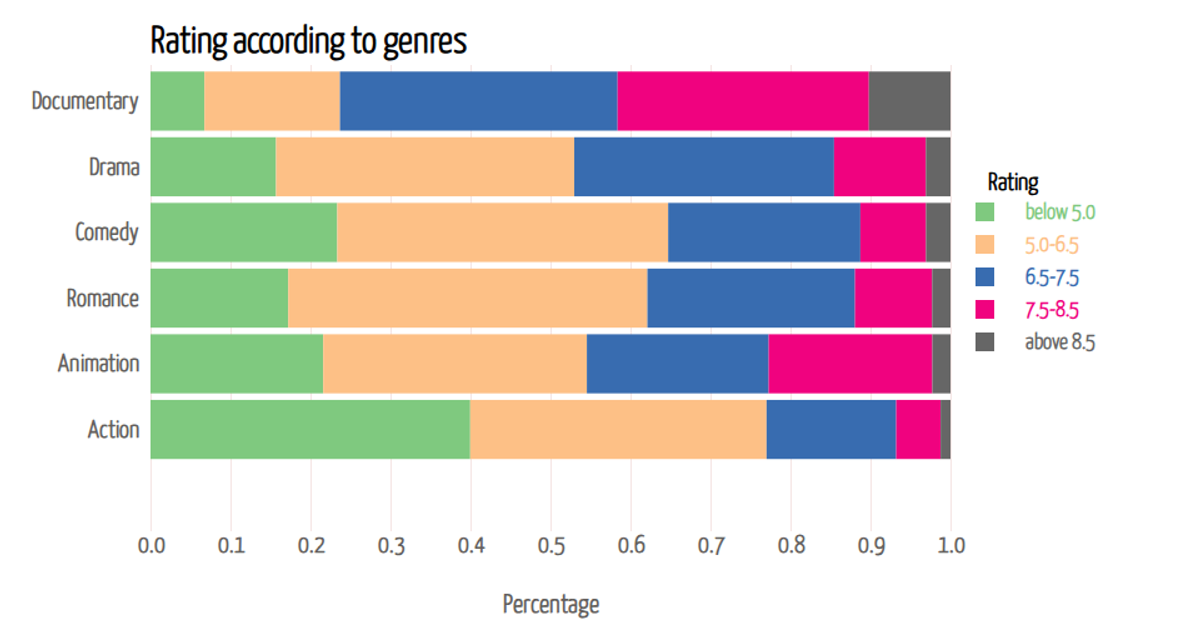
This stacked bar chart displays the percentage distribution of low, mid, and high categories across six fictional movie genres, encoded with a diverging color palette. Built with D3 v7, it uses `d3.stack()` to create the layered segments and `d3.scaleBand()` for the categorical y-axis. Rectangles render as SVG elements, with interactive tooltips triggered by mouseover events to reveal exact segment percentages. Data is loaded from a static CSV file, though the chart here uses hardcoded JavaScript arrays for demonstration.
AI-generated descriptionMIT Licensed




Comments
Sign in to join the discussion.