🌍 Public
tasa de paro
MMaría Casasola
Last edited Feb 3, 2021
Created on Feb 3, 2021
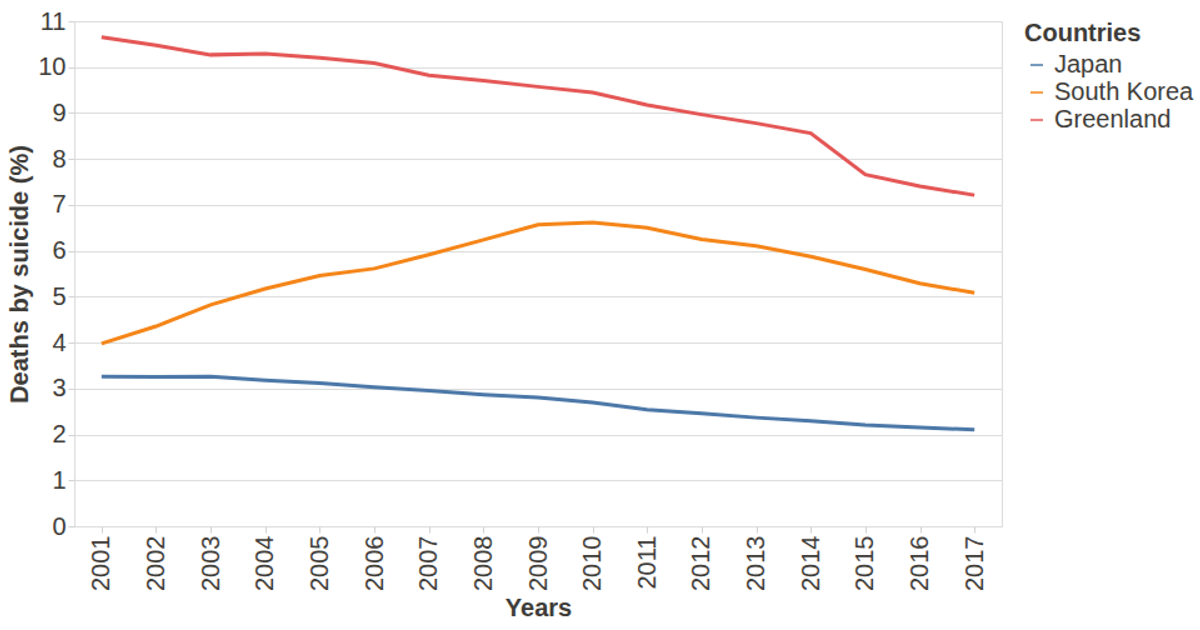
This chart displays suicide death rates per year for Japan, South Korea, and Greenland, filtering data to years after 2000. It uses the vega-lite-api to build a line mark, with the x-axis encoding the year, the y-axis encoding the death rate, and color distinguishing countries. The visualization loads data from a Gist-hosted CSV using d3.csv, and it configures axes and tooltips through vega-tooltip for improved readability.
AI-generated descriptionThis visualization was constructed using the vega-lite-api.
The idea behind this visualization was to show the percentage of deaths by suicide in some countries over the years.
The data used in this visualization can be found on Gist here: Suicide Rate Dataset
MIT Licensed



Comments
Sign in to join the discussion.