🌍 Public
Customizing Axes
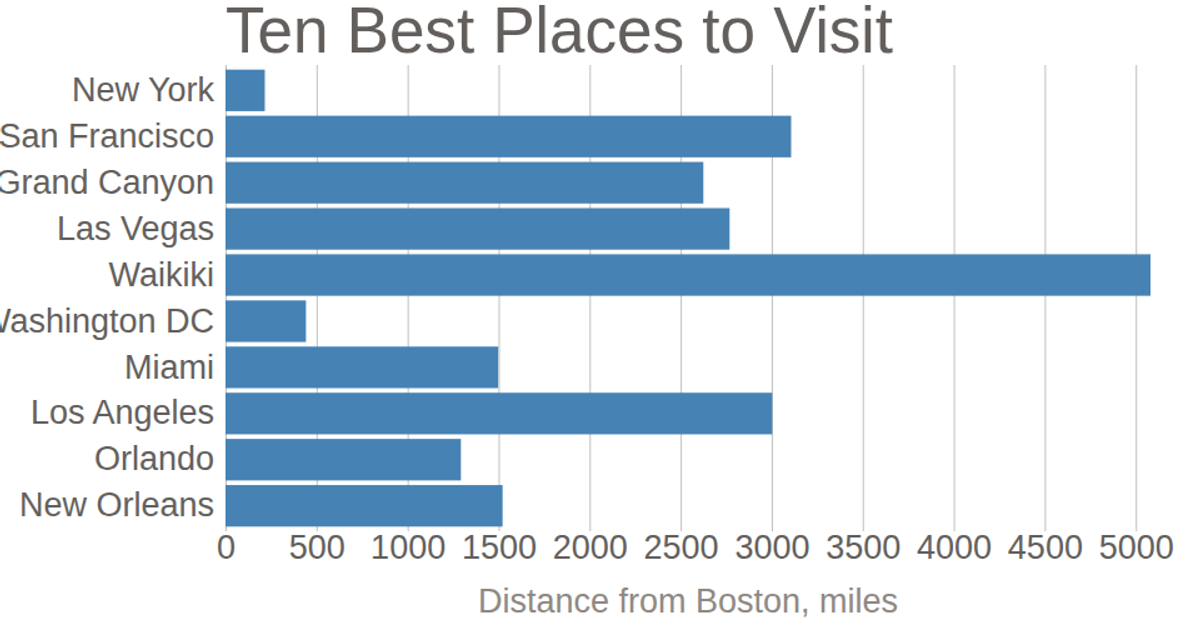
This example shows a horizontal bar chart of the ten best places to visit in the United States, with population values representing distance from Boston in miles. The chart customizes its axes by removing domain lines and tick lines from the y-axis, adding horizontal gridlines via negative tick sizes, and formatting tick labels with `d3.format`. It uses `d3.scaleLinear` and `d3.scaleBand` for positioning, `d3.axisLeft` and `d3.axisBottom` for axes, and renders as SVG with data from a CSV file.
AI-generated descriptionBased on information from https://www.planetware.com/usa/best-places-to-visit-in-the-united-states-us-ny-21.htm and https://www.distance-cities.com/.
See also the first bar chart visualization that this one builds on: Making a Bar Chart.
MIT Licensed





Comments
Sign in to join the discussion.