Fork of Missing Migrants Date Histogram
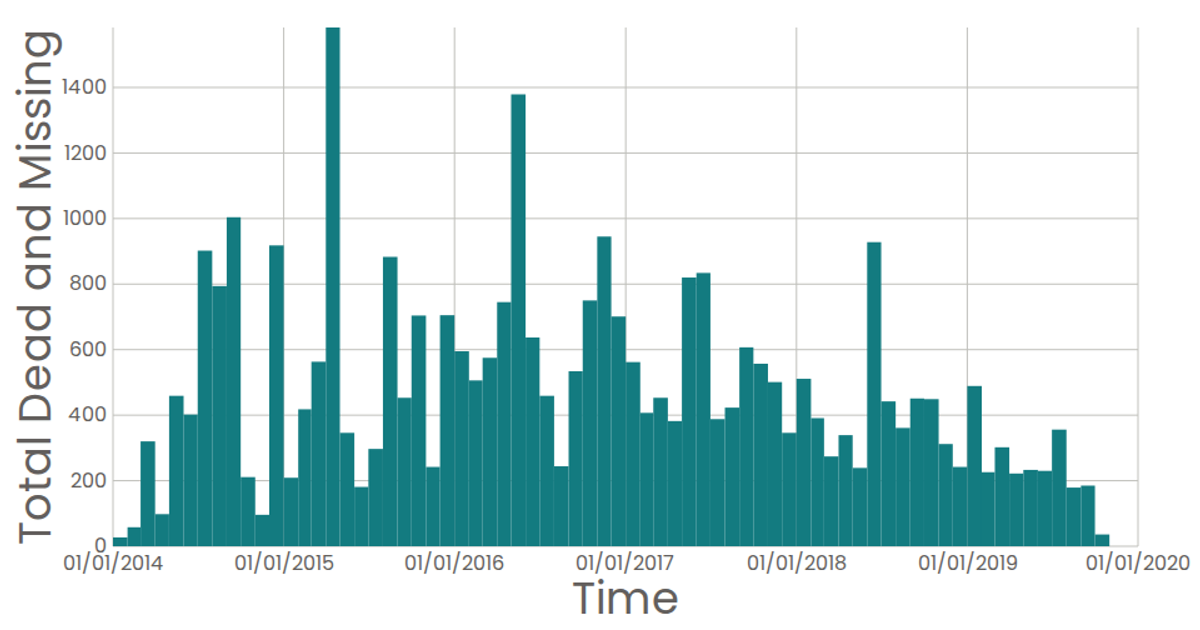
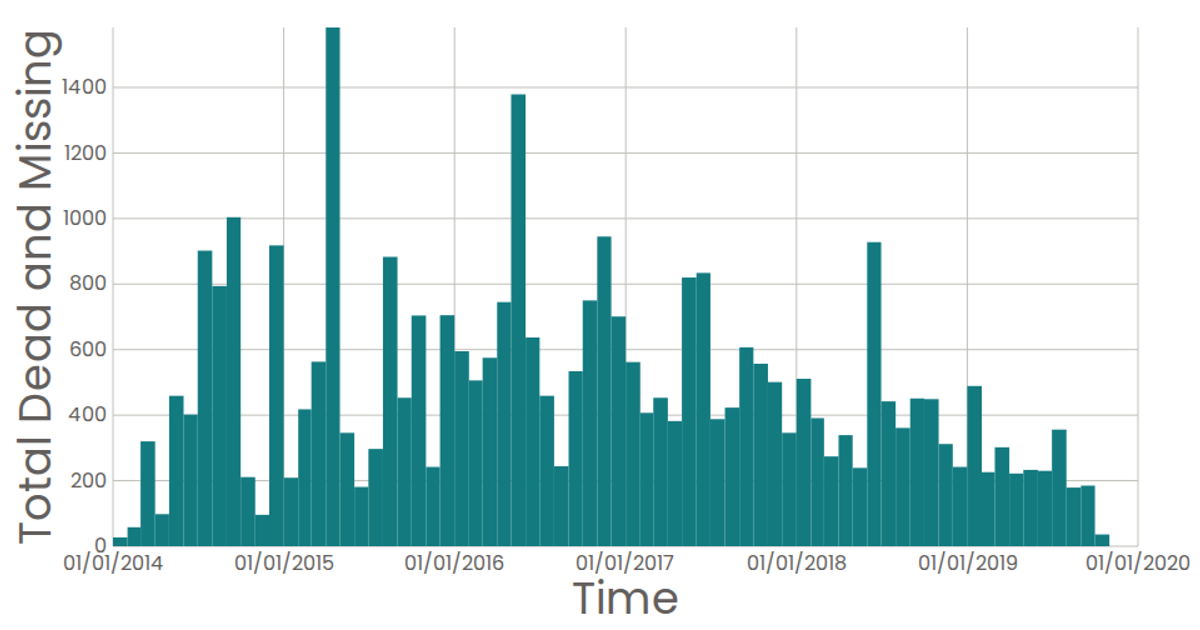
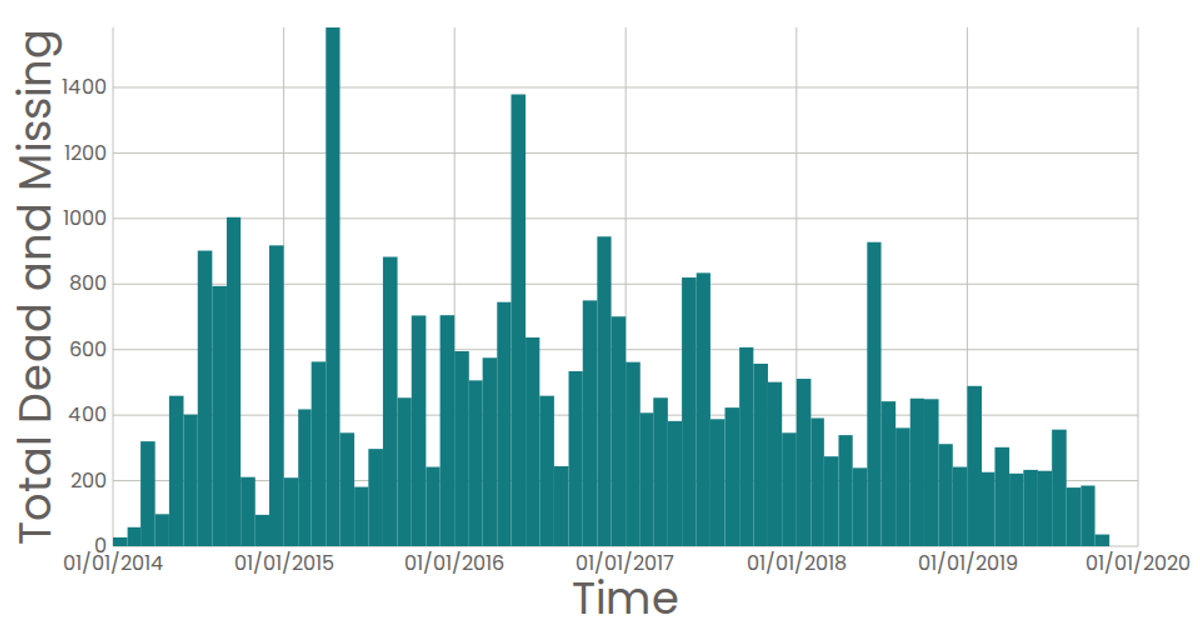
This histogram visualizes the monthly total of dead and missing migrants from the Missing Migrants Dataset. Each bar represents one month, with bar height encoding the sum of individuals reported dead or missing. The chart uses d3.bin to group individual incident records into monthly bins and d3.sum to aggregate the counts. The visualization is rendered in React with SVG, using reusable axis and mark components. The y-axis displays the aggregated death counts, while the x-axis shows time. Hovering over a bar reveals the exact count via a native tooltip. The bar for October 2019 is notably taller, reflecting a spike in that month's data. The chart is built with D3 v5 and follows a clean, minimal design consistent with the "Missing Migrants Date Histogram" theme, making it easy to observe trends and seasonal patterns in migrant deaths.
AI-generated descriptionA date histogram showing the sum total dead and missing migrants for each month.
Data from the Missing Migrants Dataset.





Comments
Sign in to join the discussion.