🌍 Public
Fork of Activity 7 Q2
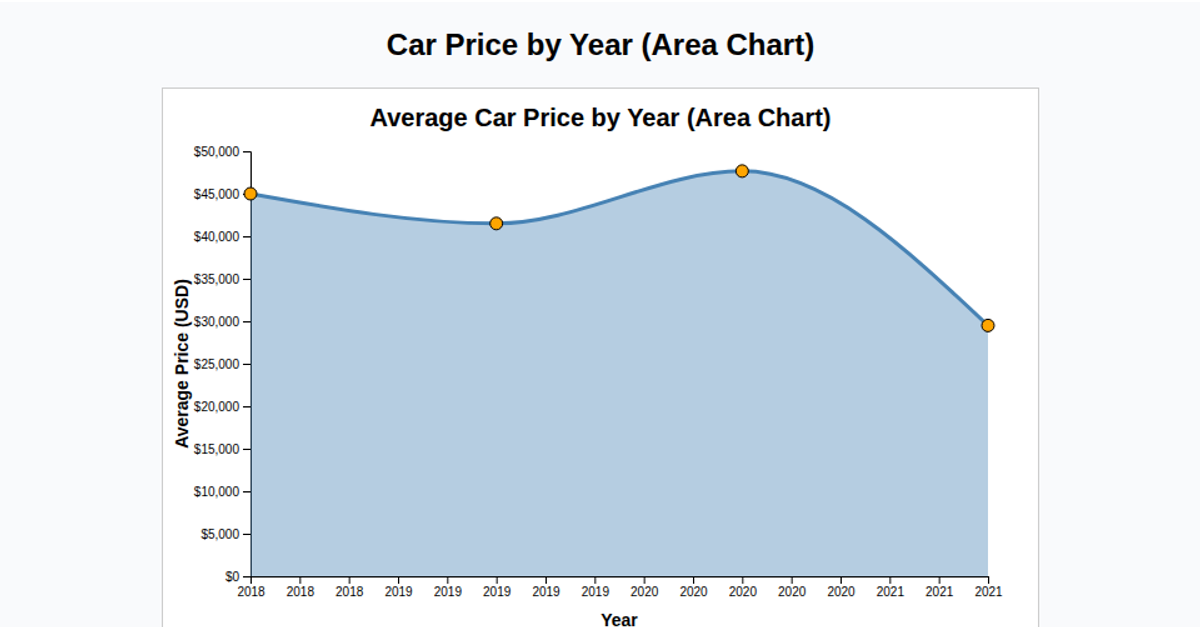
This example visualizes the average selling price of cars by year as a filled area chart. It loads a CSV dataset, parses price values expressed in Indian units (Lakh and Crore) into rupees, groups the data by year, and computes the mean price for each year. The visualization uses D3.js v7 with an SVG rendering approach, employing a linear x-scale for years and a linear y-scale for prices, rendered through the `d3.area()` generator. Axis labels and tick formatting clarify the currency in lakhs, making trends in average car prices readable over time.
AI-generated descriptionMIT Licensed




Comments
Sign in to join the discussion.