🌍 Public
6:15 line chart
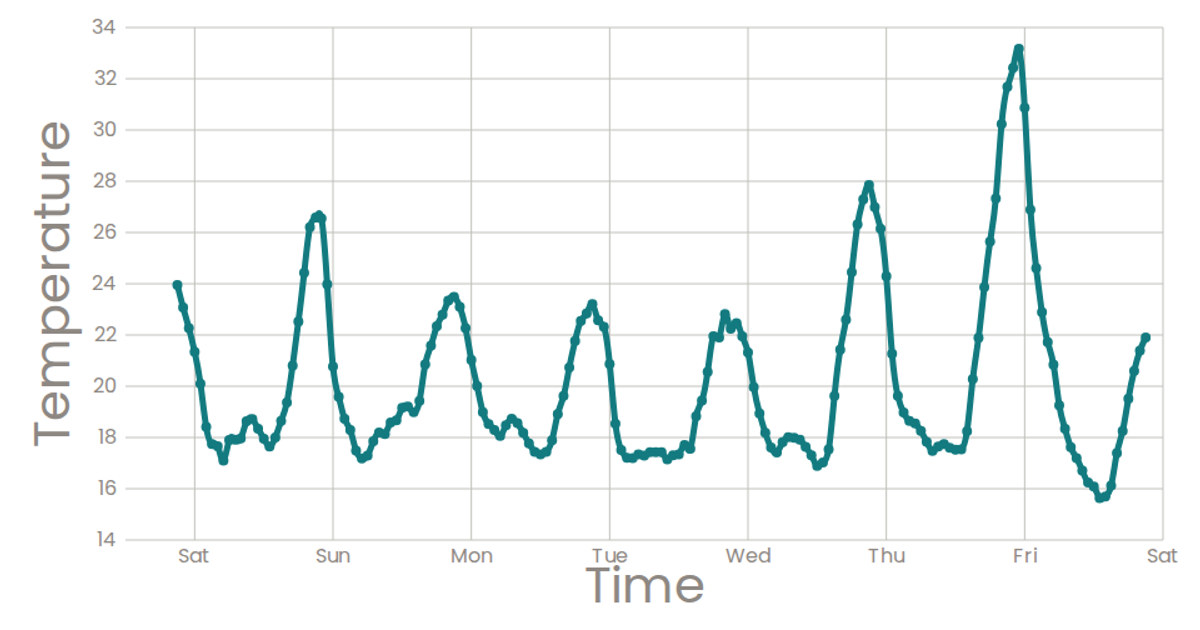
A line chart displays temperature readings over a week-long period, with each hour marked as a point along a smooth, naturally curved line. Data about San Francisco temperatures is loaded from a CSV file using D3's `csv` utility. React manages the asynchronous data loading via hooks, while D3's `scaleTime` and `scaleLinear` map the timestamp and temperature values to SVG coordinates. The chart renders axes, labels, and the data line with circles as SVG elements, using `d3.line` with `curveNatural` for the path and `d3.timeFormat` for the weekday tick labels.
AI-generated descriptionA program that loads in some data about CSS named colors using D3 utilities, and uses React state to keep track of the data.
MIT Licensed




Comments
Sign in to join the discussion.