🌍 Public
Marks and Channels
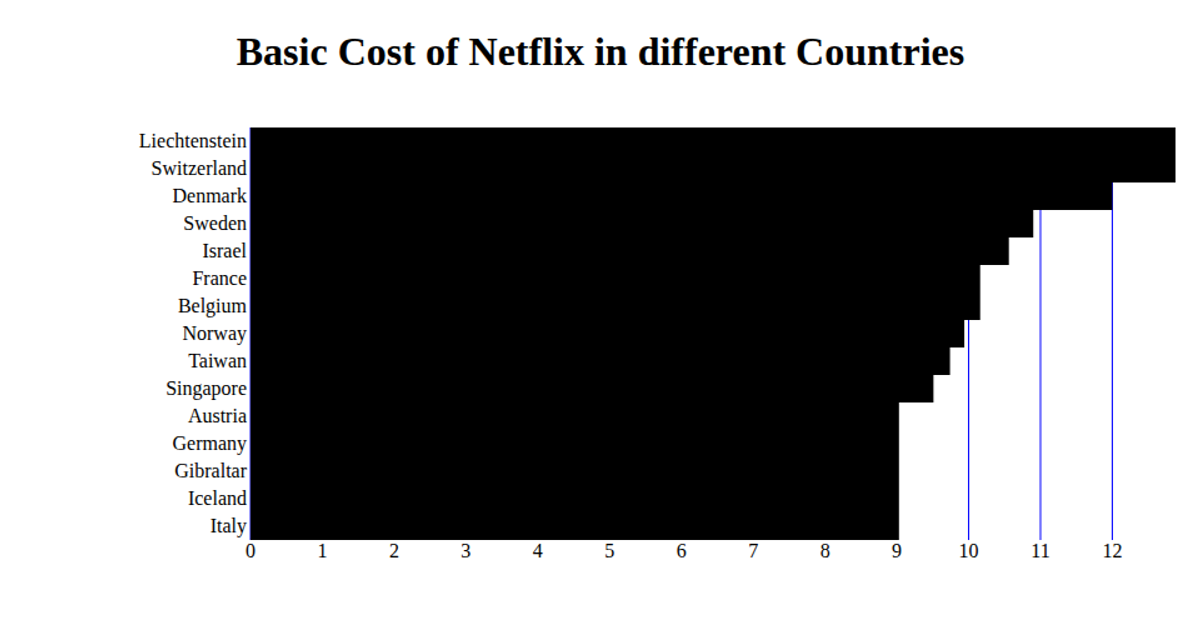
This bar chart shows the monthly basic cost of movie streaming subscriptions across twelve countries. The visualization uses rectangular bars as marks, with vertical position encoding country and horizontal bar length encoding cost. Built with React and D3 v5, the code uses `scaleBand` and `scaleLinear` for axes, renders SVG elements, and loads data from a CSV file via `d3.csv`.
AI-generated descriptionA whole smiley face
MIT Licensed



Comments
Sign in to join the discussion.