V5 Reusable Examples - Nested data, Chart (line) series - Example 4.1
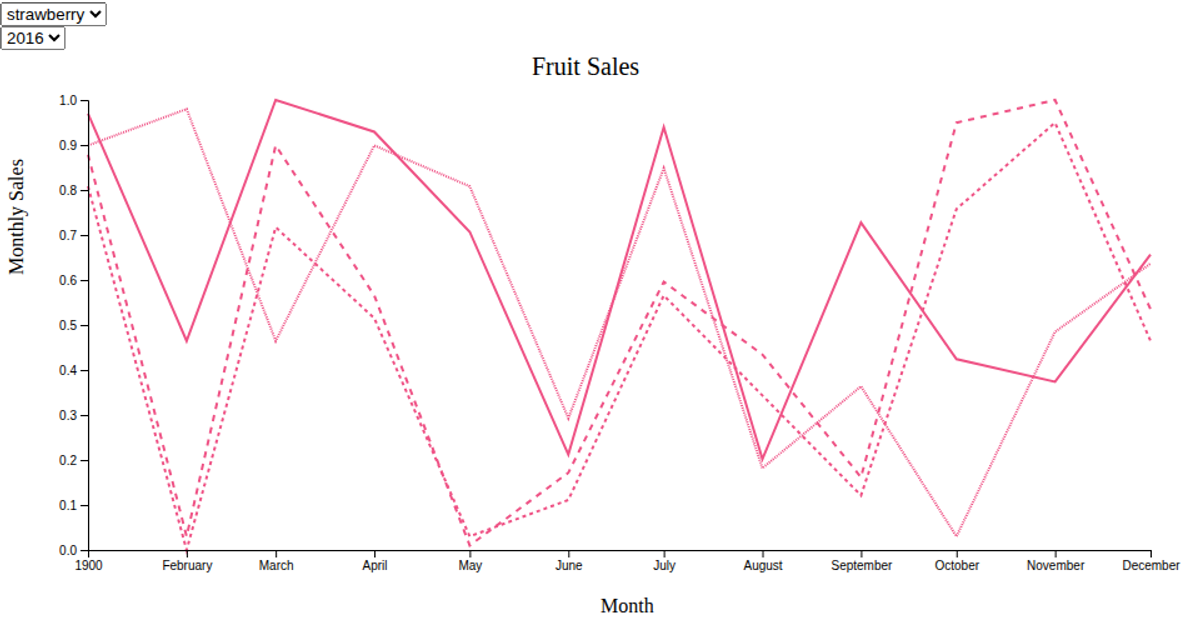
This example demonstrates how nesting data structures can be used to create a multi-series line chart, plotting monthly sales across three fruit types (strawberry, grape, blueberry) over two years. It uses D3.js v5 with an SVG rendering approach. The chart is built using the ProD3 reusable chart pattern, derived from Mike Bostock’s Towards Reusable Charts, with scales and axes constructed via d3.scaleTime, d3.scaleLinear, d3.scaleOrdinal, and d3.axisBottom and d3.axisLeft. Data is loaded from a CSV file via d3.csv.
AI-generated descriptionAn exploration of nesting data. 1 - simple line chart.
Using the tutorial and series of charts described here:
https://amber.rbind.io/2017/05/02/nesting/
d3.js ver: v5.
D3 pattern used:
A vanilla HTML implementation.
Reusable structure:
- derived from Mike Bostock's Towards Reusable Charts (https://bost.ocks.org/mike/chart/) as the source of the foundational principles.
- But uses the ProD3 pattern (Pro D3.js Use D3.js to Create Maintainable, Modular, and Testable Charts by Marcos Iglesias https://www.apress.com/gp/book/9781484252024) as the basis for the charts.
Addtional help from and aknowledgement to:
Mastering D3.js by Castillo Pablo Navarro. https://www.packtpub.com/web-development/mastering-d3js
Data Visualization with D3.js Cookbook by Nick Qi Zhu https://www.packtpub.com/product/data-visualization-with-d3-js-cookbook/9781782162162



Comments
Sign in to join the discussion.