🌍 Public
ICE 7 Q3
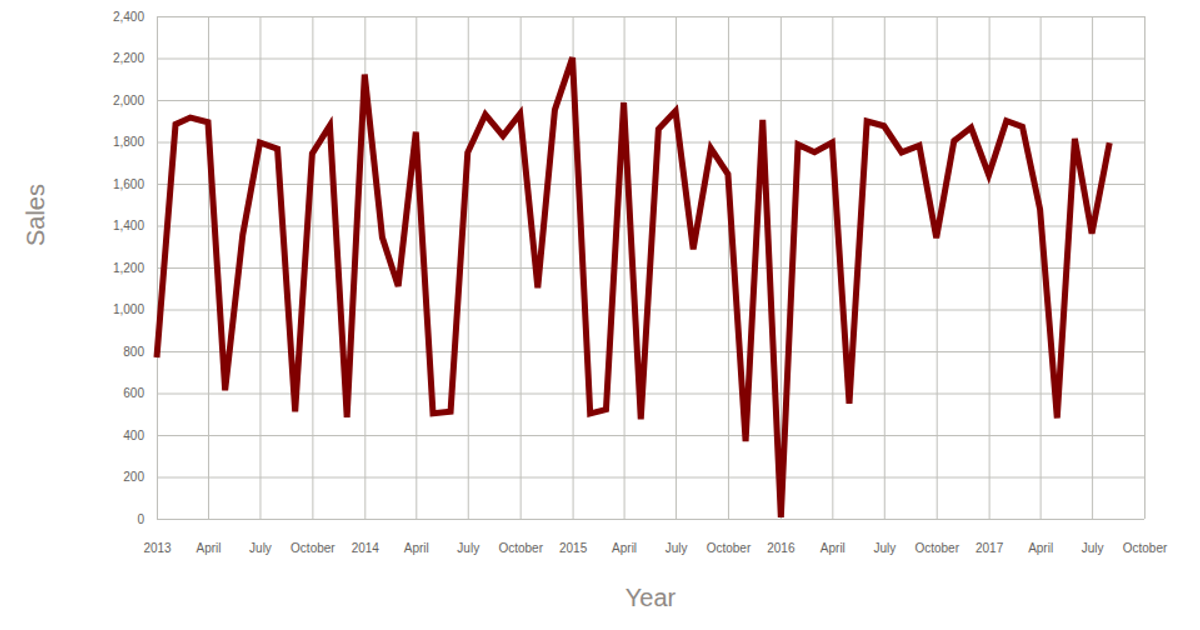
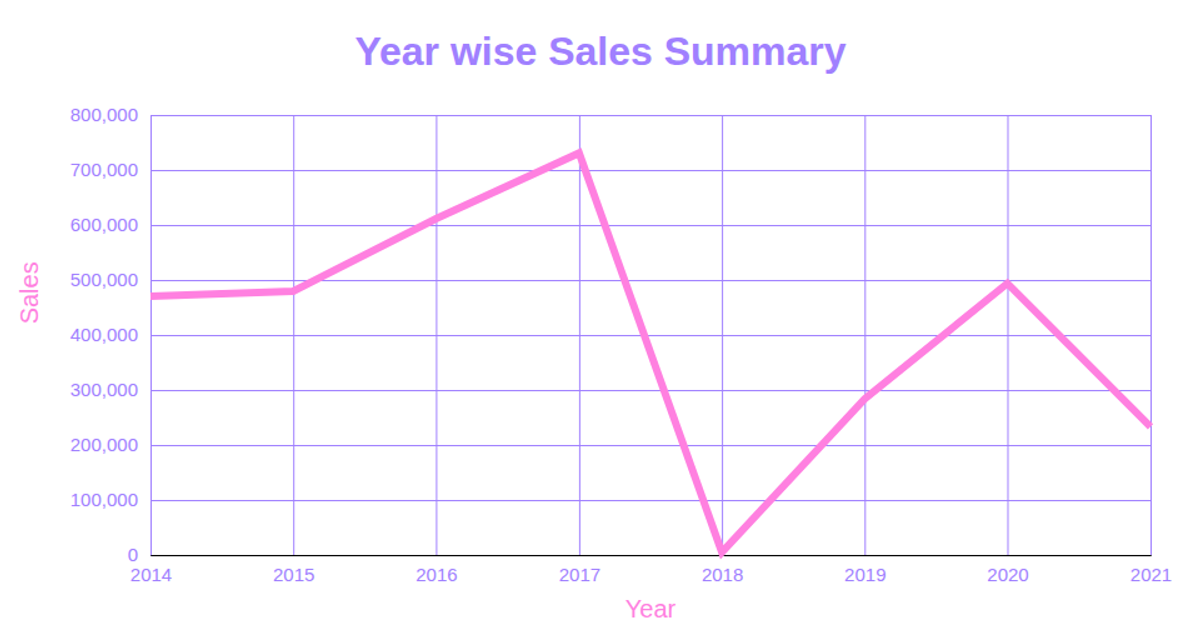
This line chart visualizes shampoo sales over a 15-year period, with the year on the x-axis and sales units on the y-axis. The chart is rendered as an SVG using D3 v5, employing `scaleTime` and `scaleLinear` for the axes and `line` to generate the path. Data is loaded from a CSV via GitHub Gist, and axis labels are added using `axisLeft` and `axisBottom`.
AI-generated descriptionA demonstration of how to start using D3 version 6.
MIT Licensed



Comments
Sign in to join the discussion.