🌍 Public
Untitled
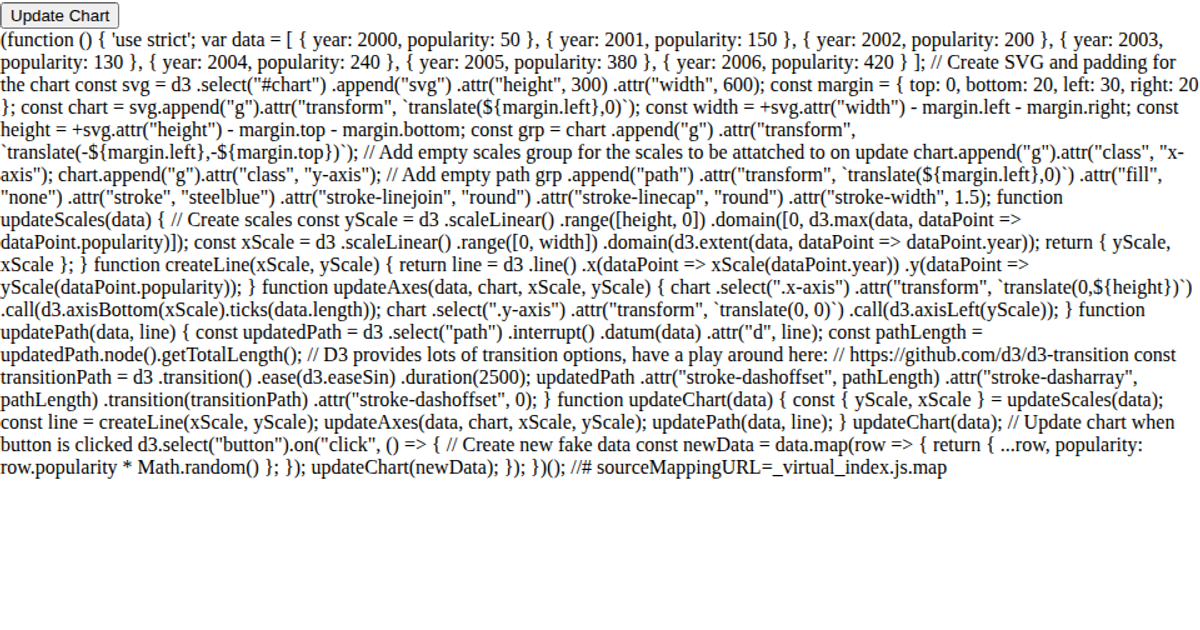
This interactive line chart displays the evolution of audio features—energy, liveness, valence, speechiness, and danceability—across playlist genres for different artists. Users select an artist via buttons, which triggers a D3.js animation that removes existing data groups and redraws the chart from a corresponding CSV file. The visualization uses d3.csv to load data, d3.scaleLinear for axes, and d3.scaleOrdinal with a custom color palette to distinguish genres. SVG elements and a legend are rendered on a fixed canvas, with transitions applied when updating the lines.
AI-generated descriptionMIT Licensed



Comments
Sign in to join the discussion.