🌍 Public
Choropleth map interactive filtering
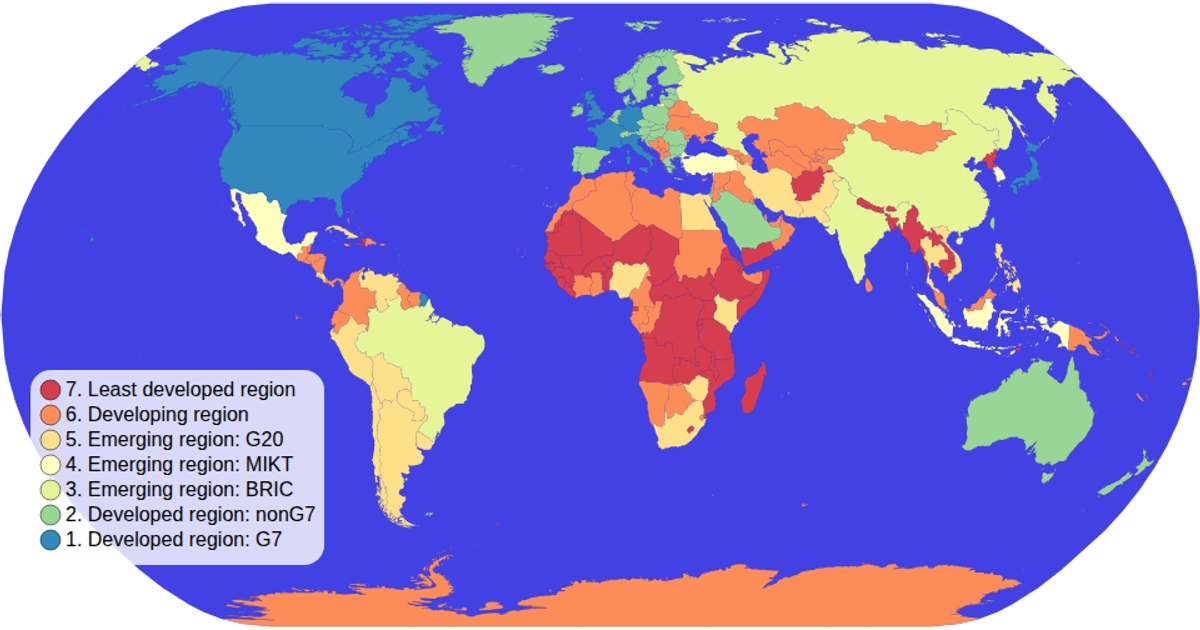
This interactive choropleth map displays world countries colored by economic classification, with a legend that filters the map by clicking a category. Users can zoom and pan the map, and selected countries are highlighted while unselected ones fade. The visualization uses D3 v5 APIs including `d3.geoNaturalEarth1`, `d3.geoPath`, `d3.zoom`, and `d3.scaleOrdinal`, rendering with SVG. Data comes from the World Atlas TopoJSON file merged with TSV metadata.
AI-generated descriptionMIT Licensed




Comments
Sign in to join the discussion.