🌍 Public
heatmap
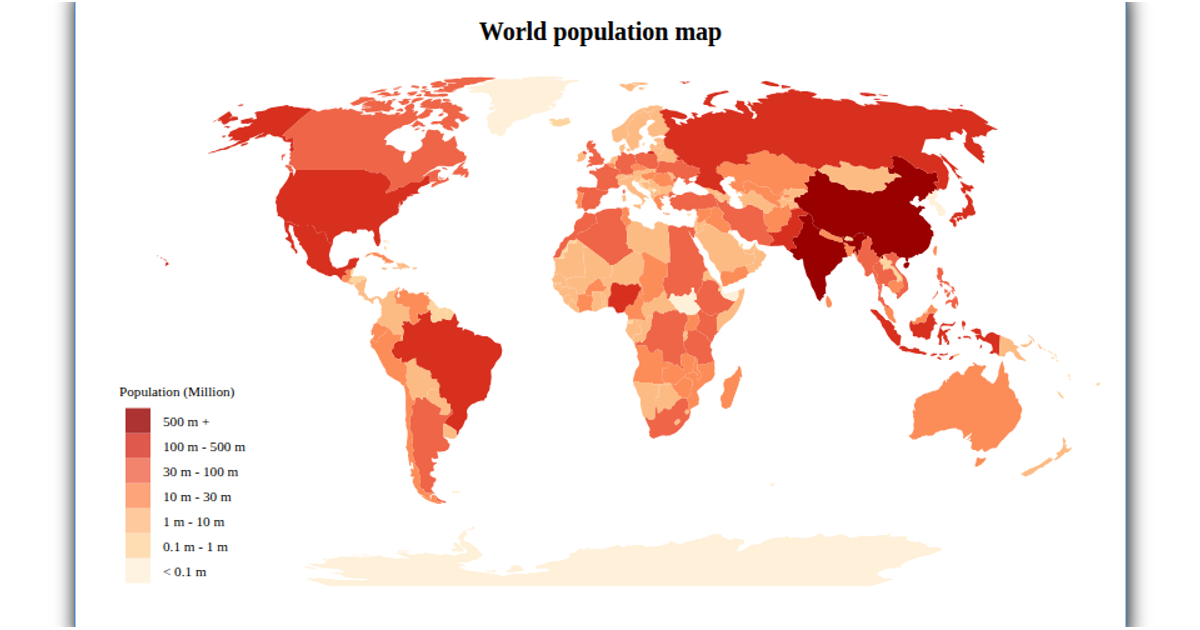
This heatmap visualizes world population data across countries using a choropleth map. The map renders SVG paths for each country, with fill patterns representing population thresholds. It uses D3.js v4 for data loading and map generation, specifically `d3.geoMercator` for projection and `d3.scaleThreshold` to map population ranges to distinct line-texture patterns from the `textures` library. Country boundaries and population data come from external GeoJSON and CSV files fetched via `d3.queue`.
AI-generated descriptionA bare minimum HTML page.
See also React Starter.
MIT Licensed



Comments
Sign in to join the discussion.