🌍 Public
Fork of Smiley face part 1
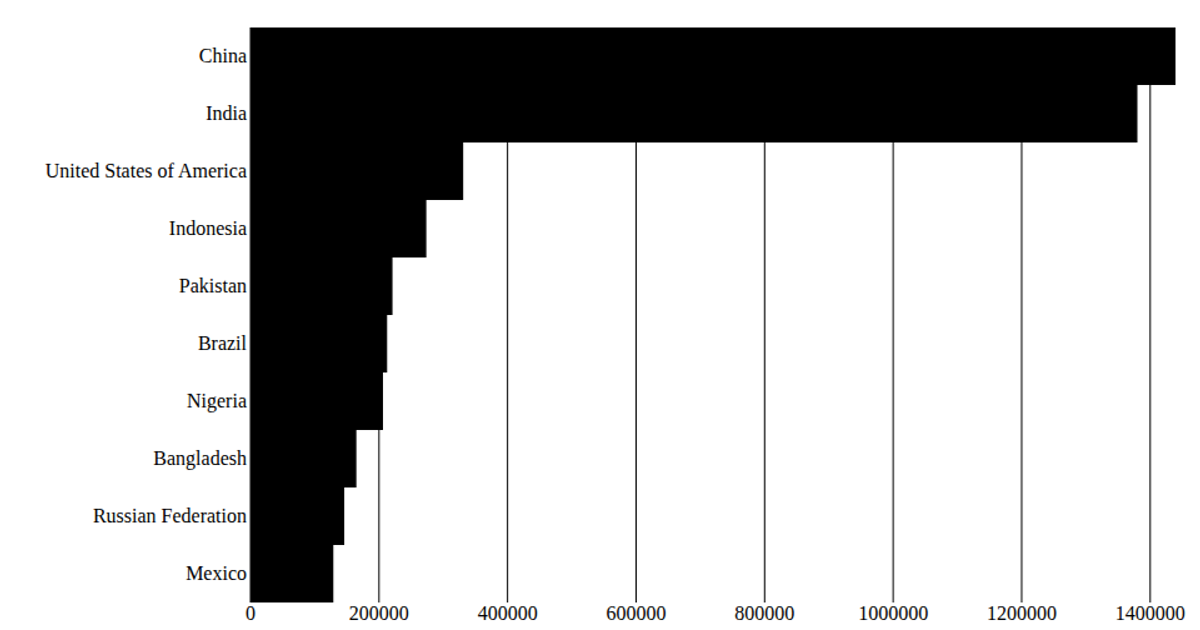
This visualization displays the populations of ten countries as horizontal bars, scaled proportionally to their population values. The chart uses D3's `scaleLinear` to map population data from a CSV file to pixel widths, with each bar's length representing its country's total population. The React-based rendering appends SVG `rect` elements to the canvas, and the data is preprocessed by multiplying the population values by 1000 before scaling.
AI-generated descriptionHalf way towards a smiley face. Smiley mark down (MD).
MIT Licensed







Comments
Sign in to join the discussion.