Fork of Making a Bar Chart
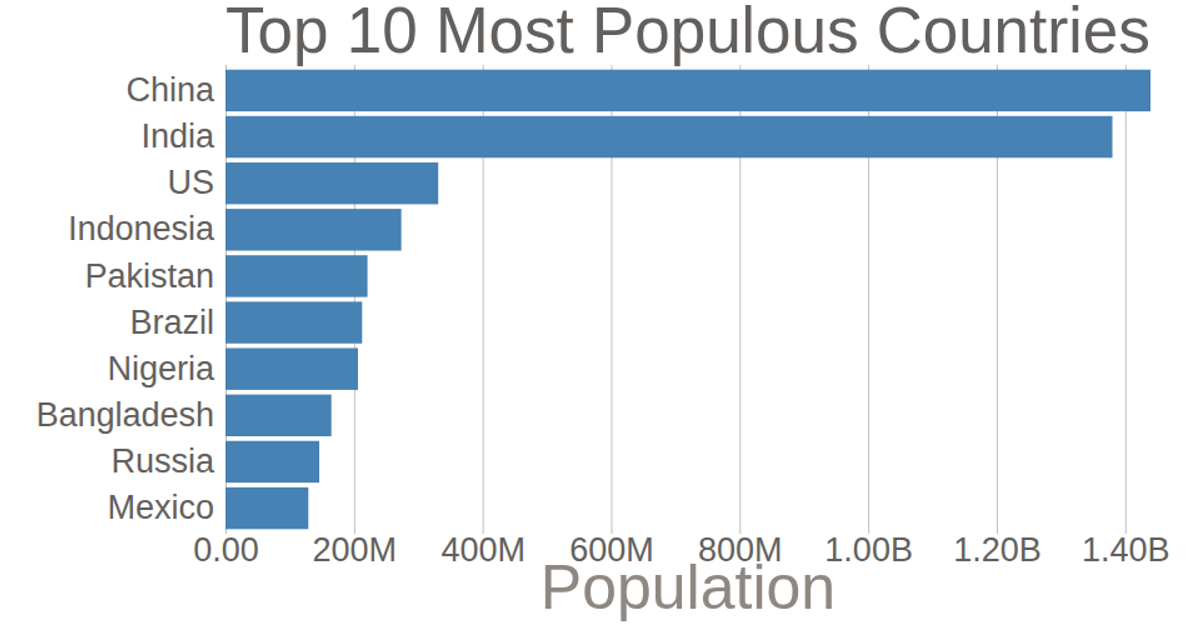
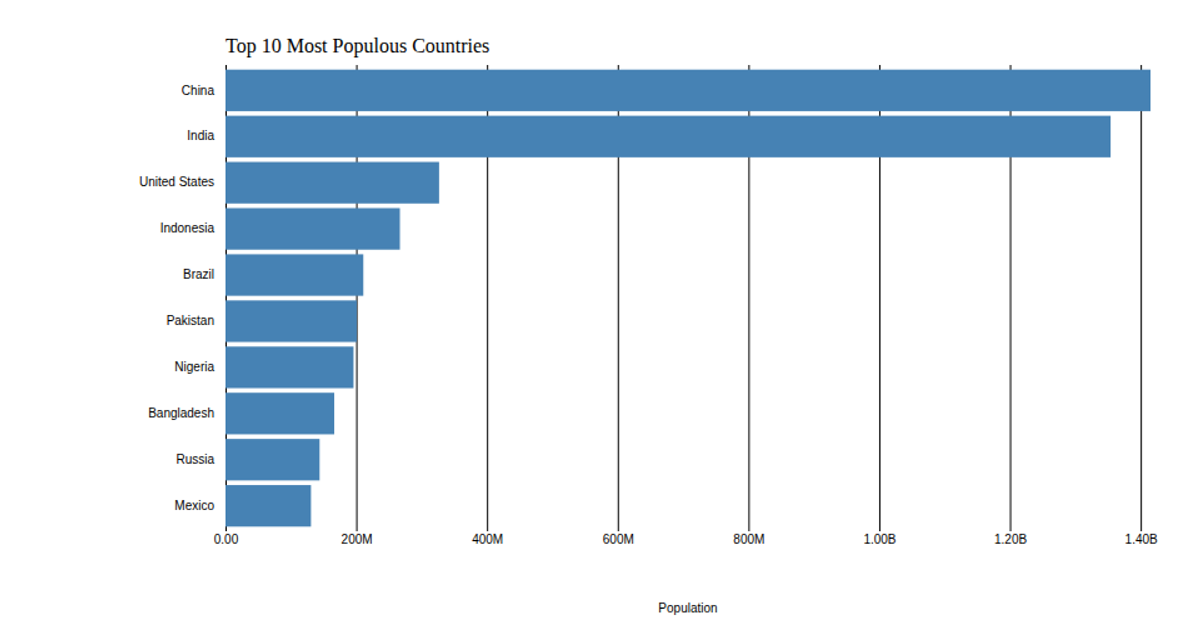
A horizontal bar chart ranks the ten most populous countries according to 2018 United Nations population estimates, with China leading and Mexico last. The bars are rendered as SVG rectangles using D3 v5’s `scaleBand` for the categorical y-axis and `scaleLinear` for the quantitative x-axis. Axis ticks are styled with `axisLeft` and `axisBottom`, and population values are formatted using `format('.3s')` with a custom replacement to show billions. Data is loaded asynchronously from a CSV file via `csv()`, with each value multiplied by 1,000.
AI-generated descriptionCreating a bar chart from csv data.
This bar chart shows population of the top 10 most populous countries. The data comes from the year 2018 estimate in United Nations: World Population Prospects 2017. It also demonstrates customization of D3 axes.



Comments
Sign in to join the discussion.