🌍 Public
111
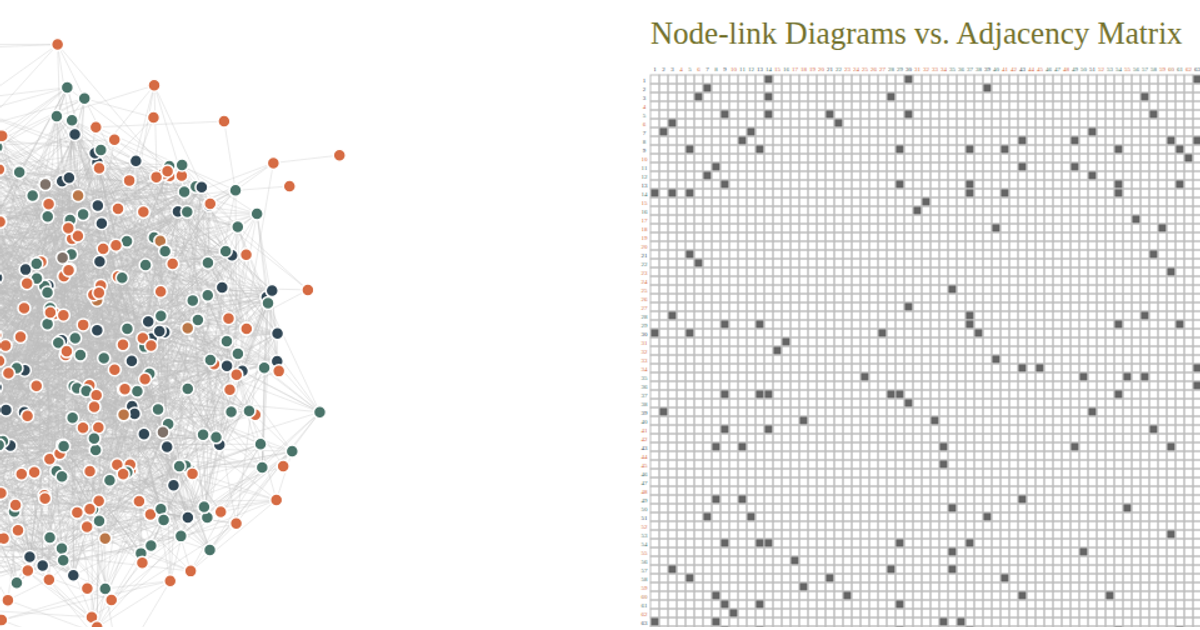
This example combines a force-directed graph with an adjacency matrix to explore network connections. Users can click nodes in the graph or cells in the matrix to highlight corresponding links in red. The visualization uses d3.forceSimulation for the graph layout and d3.zoom for panning and scaling. Data is rendered as SVG elements, with matrix cells colored by link weight.
AI-generated descriptionMIT Licensed




Comments
Sign in to join the discussion.