🌍 Public
Activity 8_Task 3.2 Tutorial
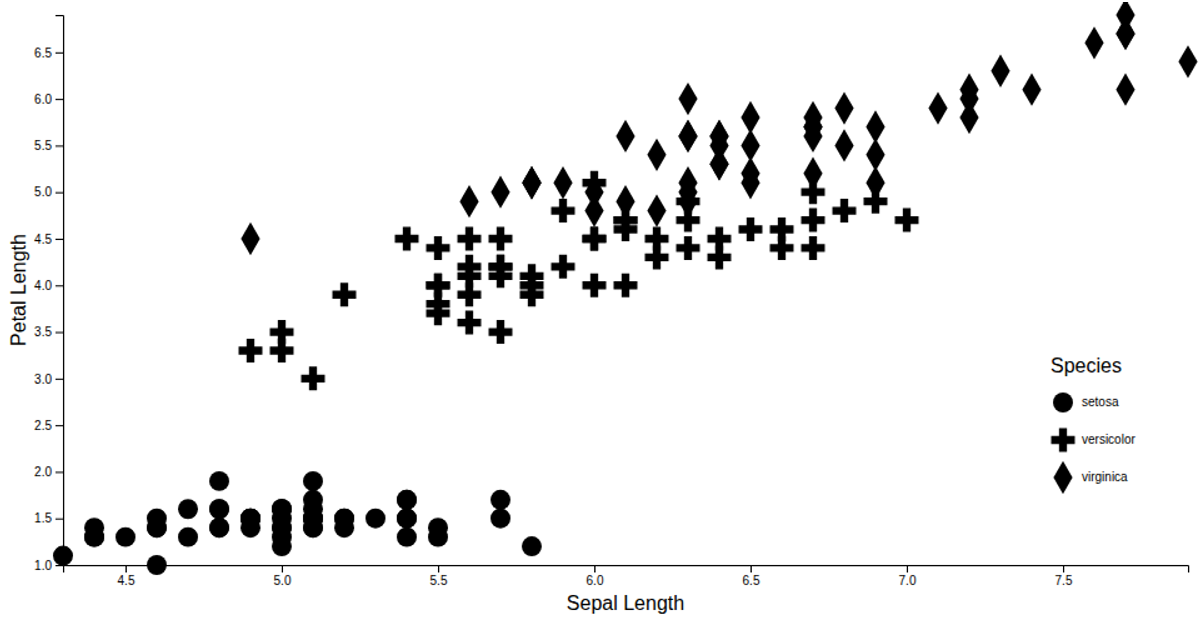
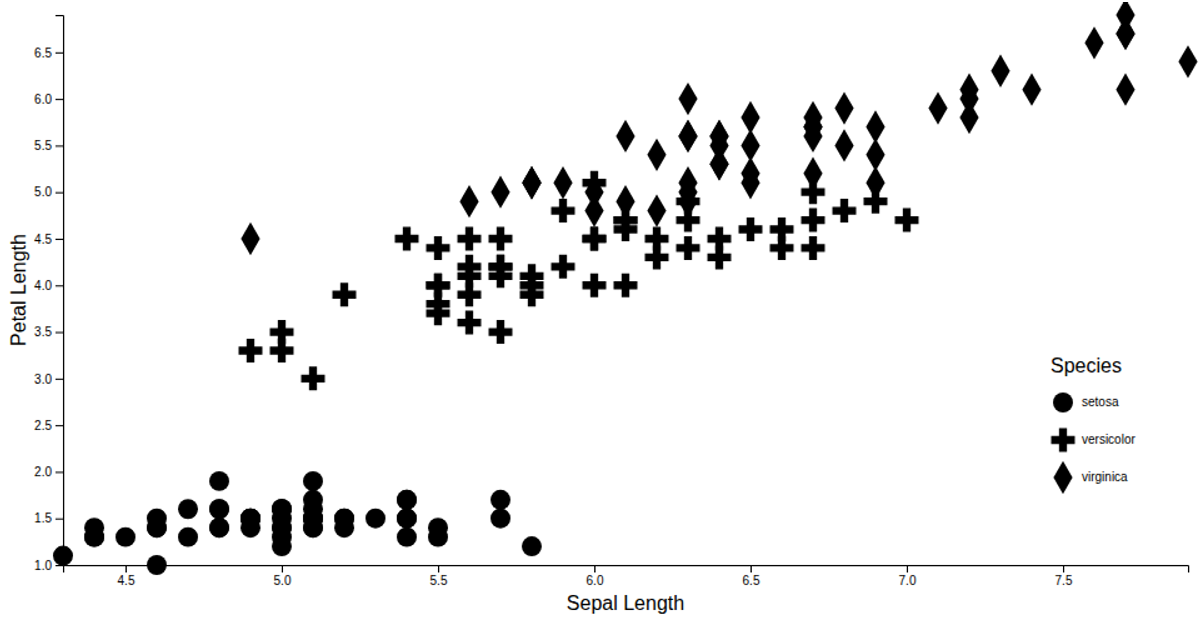
This scatter plot visualizes the IRIS dataset, mapping sepal length on the x-axis and petal length on the y-axis, with each species represented by a distinct shape and listed in a shape legend. The D3.js v7 code uses `scaleLinear`, `scaleOrdinal`, and `symbol` to encode the data, while custom modules (`axes.js` and `shapeLegend.js`) handle axis rendering and legend generation. Data is loaded asynchronously via `fetch` and parsed with `csvParse`.
AI-generated descriptionScatter plot of the IRIS dataset
MIT Licensed



Comments
Sign in to join the discussion.