Customizing Axes
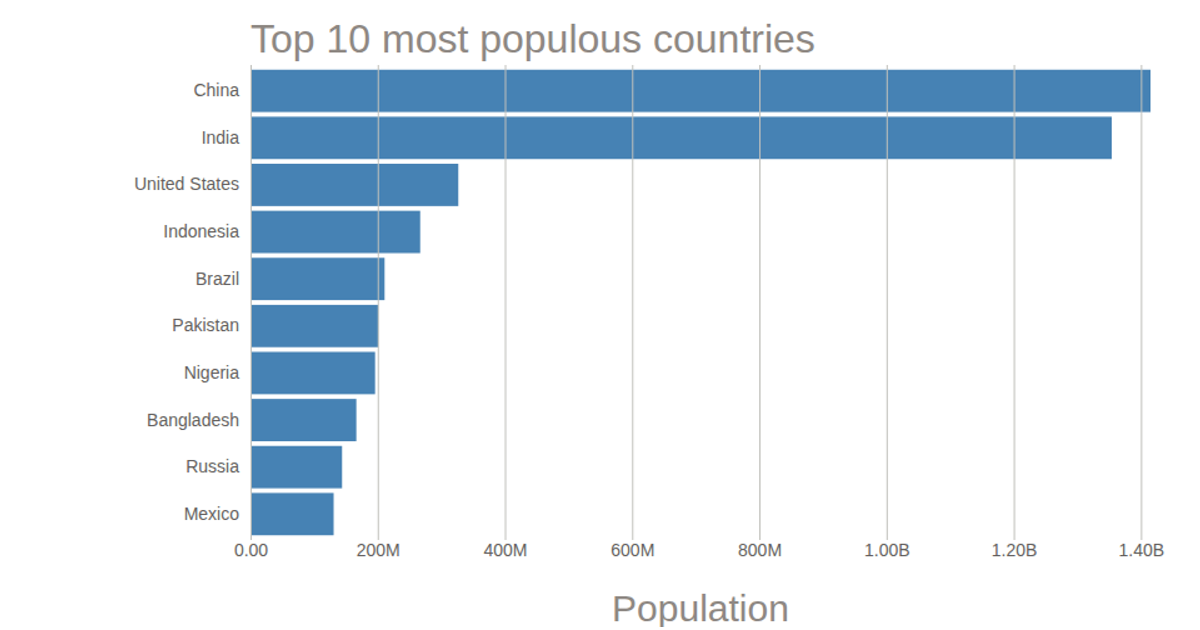
This bar chart shows the population of the top 10 most populous countries, using 2018 estimates from the United Nations World Population Prospects 2017. It builds on a prior bar chart example, adding customized axis styling through D3 v5 APIs such as `d3.csv` for data loading and `d3.select` for SVG manipulation. The chart uses SVG rendering with styled tick lines, tick labels, an axis label, and a title, all formatted via CSS classes. The data is loaded from a local CSV file containing country names and population figures.
AI-generated descriptionThis bar chart shows population of the top 10 most populous countries. The data comes from the year 2018 estimate in United Nations: World Population Prospects 2017. It also demonstrates customization of D3 axes.
See also the first bar chart visualization that this one builds on: Making a Bar Chart.



Comments
Sign in to join the discussion.