🌍 Public
Fork_Cherryl
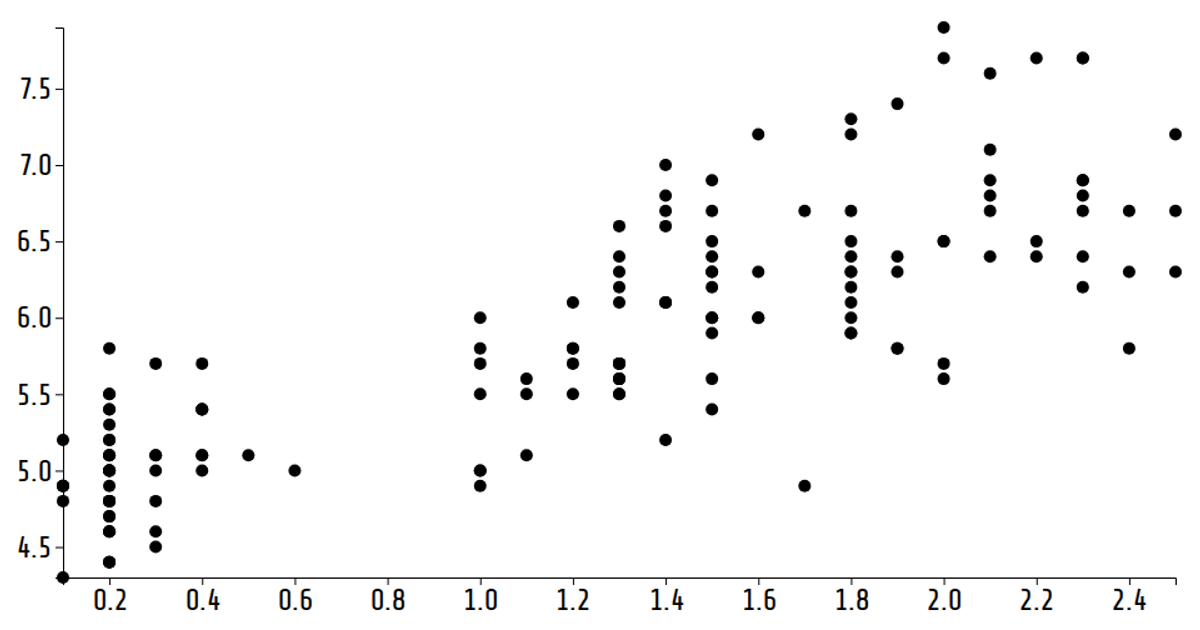
This animation cycles through different iris flower measurements on the x-axis of a scatter plot, using D3.js to render the data from the Iris dataset. The visualization displays four quantitative variables—petal width, sepal width, petal length, and sepal length—with each species (setosa, versicolor, virginica) colored distinctly. A reusable `scatterPlot` component, built with D3 scales and axes, updates at set intervals via `setInterval` to rotate through the dimensions. SVG circles represent individual flowers, with a legend and axis labels complementing the animated transitions.
AI-generated descriptionA demonstration of reusable scatter plot.
MIT Licensed





Comments
Sign in to join the discussion.