🌍 Public
Interactive Sunburst Chart
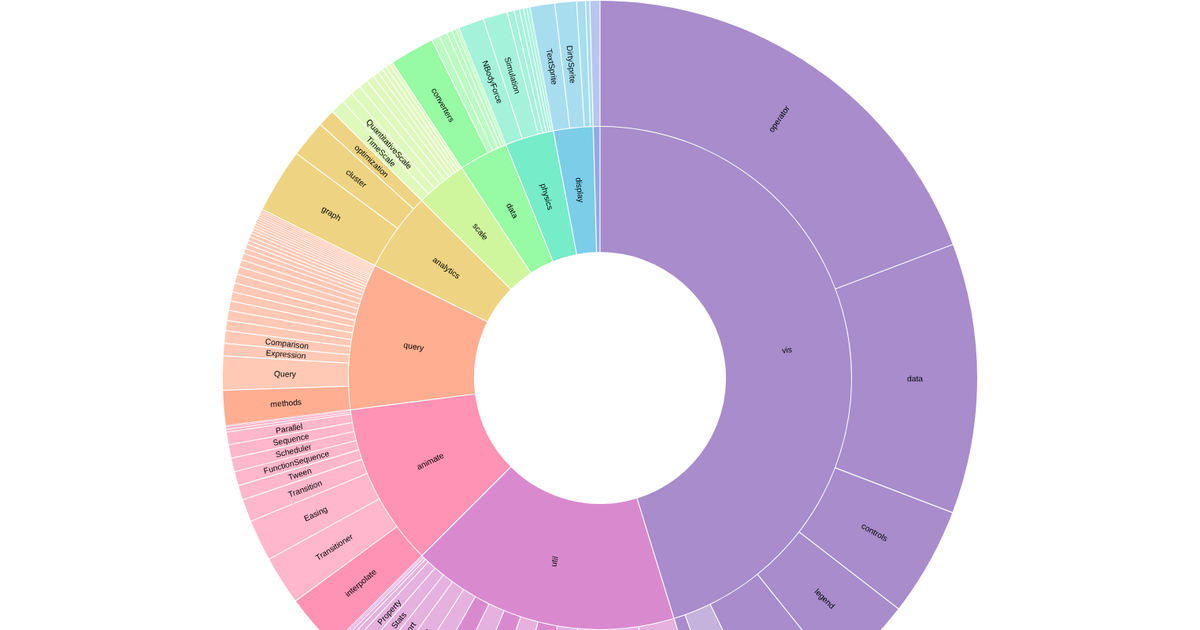
This interactive sunburst chart visualizes the outcomes of a set of "faced questions," branching from a central node through categories like "Visit" and "Not Visit," and further into "Attempted," "Correct," and "Incorrect" subcategories. Clicking any node collapses or expands its child branches, with animated transitions updating the tree layout. The visualization uses D3 v5's `tree` layout, `hierarchy` data structuring, and `linkHorizontal` path generator, rendering to SVG with custom zoom functionality via `d3.zoom`.
AI-generated descriptionMIT Licensed




Comments
Sign in to join the discussion.