🌍 Public
pseudo-scatter-plot-with-d3
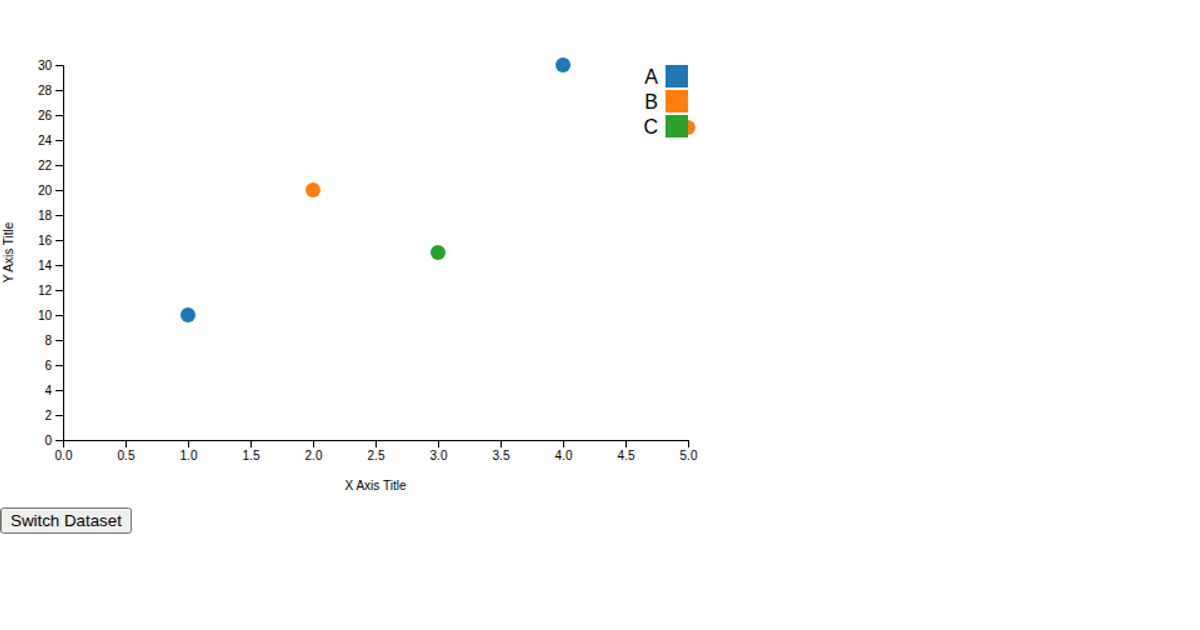
This example presents a clickable scatter plot rendered with D3.js and the d3-rosetta utility library, which enables unidirectional data flow. It loads data from a CSV file containing circle positions, radii, and colors, and renders them as interactive SVG circles. When clicked, a circle becomes highlighted with a black stroke and raised to the front. The visualization demonstrates d3-rosetta’s `unidirectionalDataFlow`, `createStateField`, and `one` utilities, along with D3’s `select`, `csv`, and data joins for updating the DOM.
AI-generated descriptionMIT Licensed


Comments
Sign in to join the discussion.