🌍 Public
Working with time
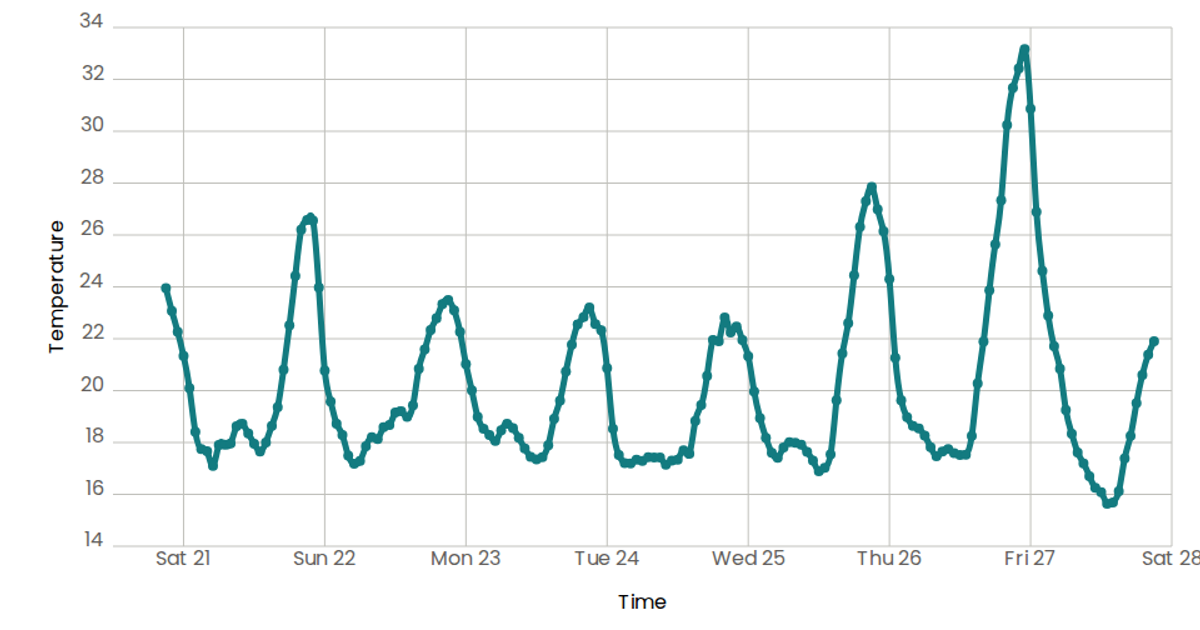
This example visualizes temperature readings over time as a smooth, curved line chart, showing how temperature fluctuates across the days of a week. The data comes from the Data Canvas Sense of Your City dataset, specifically week temperature measurements for San Francisco. Built with React and D3 v5, it uses `scaleTime` and `scaleLinear` for axes, `d3.line()` with `curveNatural` to generate the smooth path, and `timeFormat('%a')` to display weekday labels. The SVG rendering includes custom axis components and a styled mark path with rounded line joins.
AI-generated descriptionA scatterplot of Data Canvas Sense of Your City Dataset.
MIT Licensed




Comments
Sign in to join the discussion.