🌍 Public
Fork of ICE - 7 Pie Chart Maanas Katta
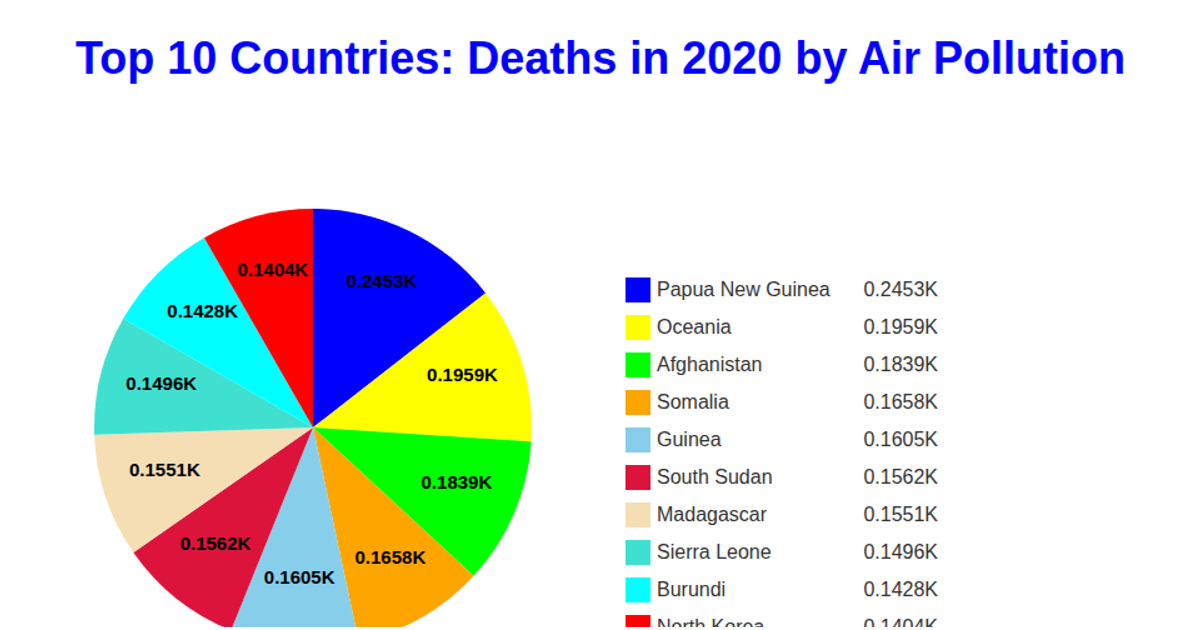
This fork of an ICE example visualizes the top 10 countries by air pollution deaths in 2020 as a pie chart, with each slice labeled by death count in thousands and a matching color-coded legend. Using d3.csv to load data from a GitHub gist, it applies d3.pie, d3.arc, and d3.scaleOrdinal to compute and render SVG paths, while d3.arc.centroid positions the slice text labels.
AI-generated descriptionMIT Licensed




Comments
Sign in to join the discussion.