🌍 Public
Test:Iris Scatter Plot with selection
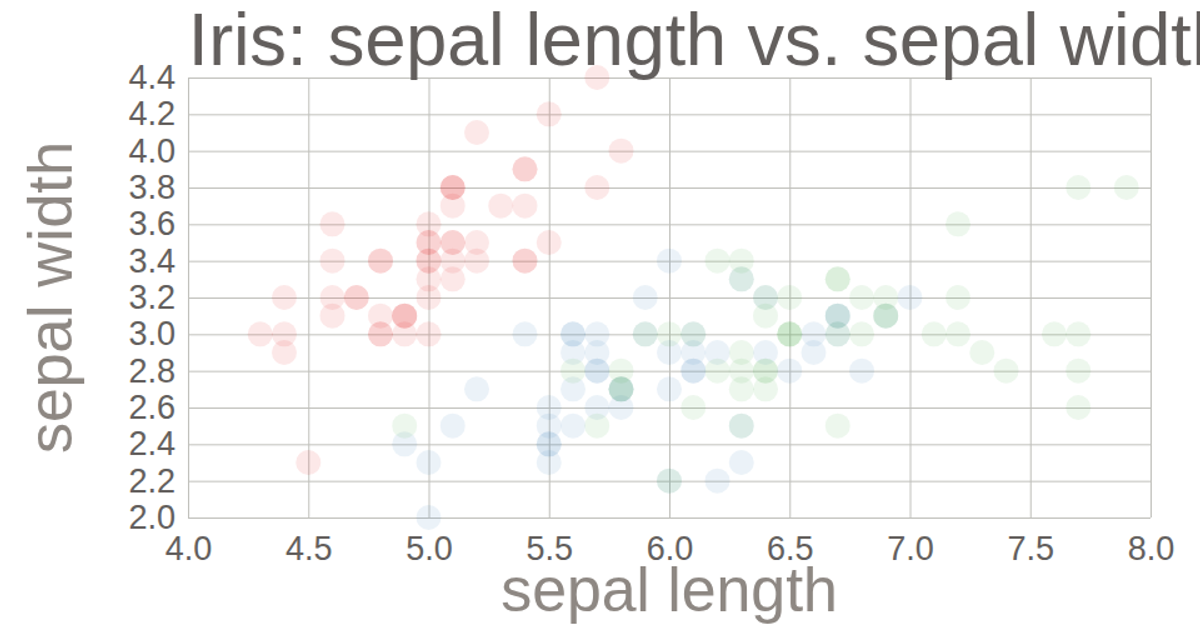
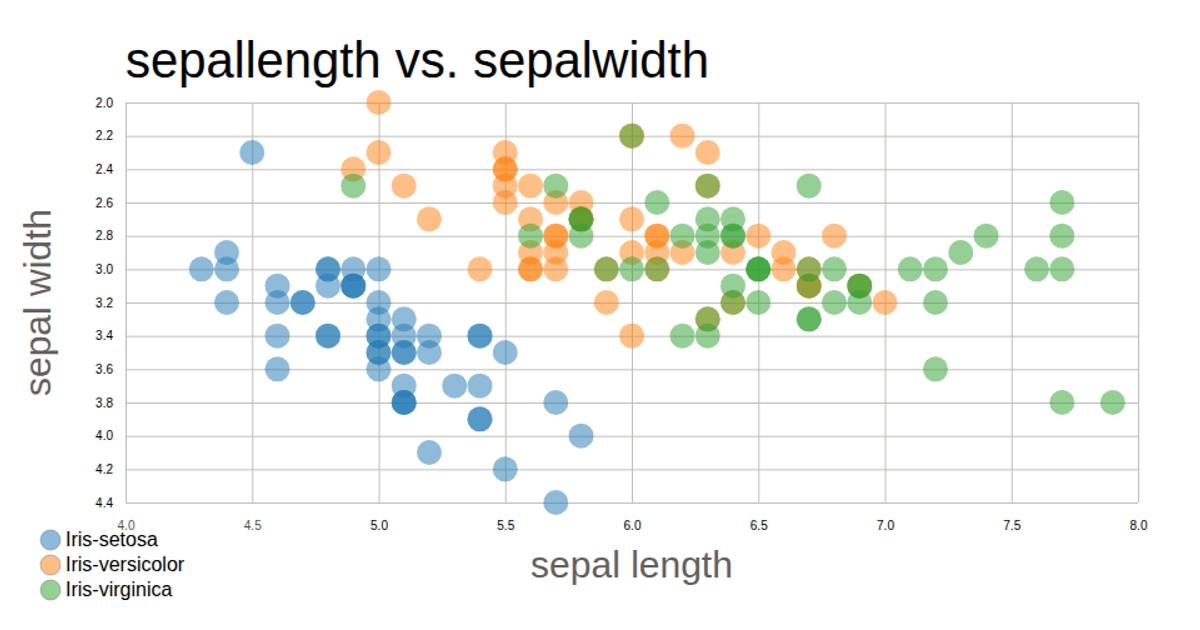
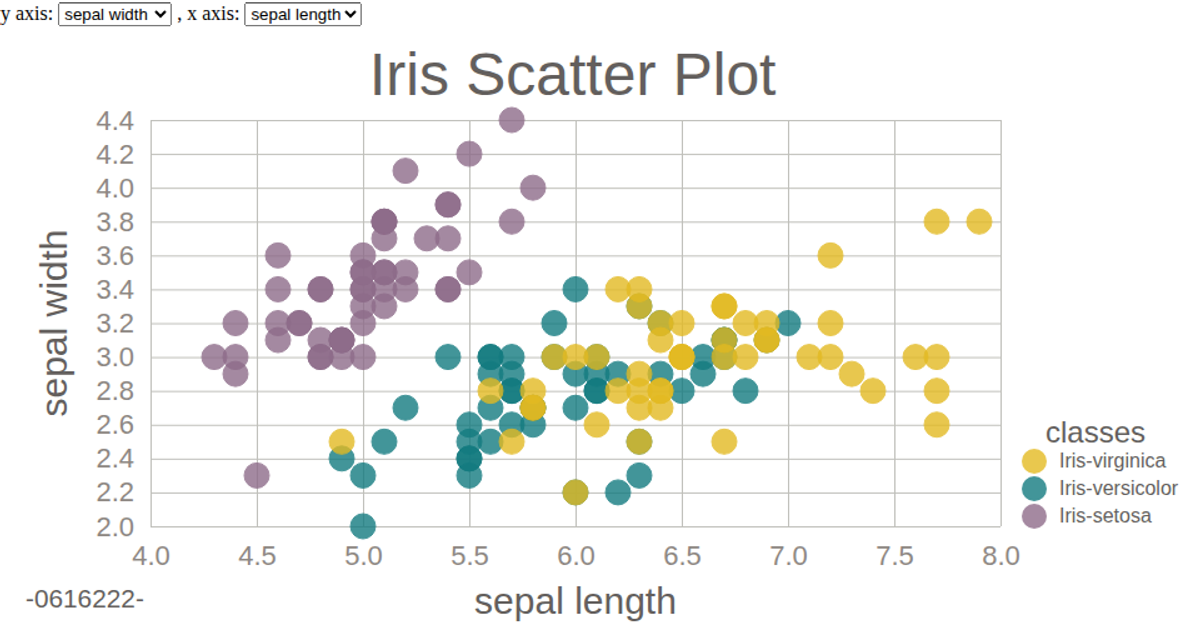
This scatter plot compares sepal length and sepal width for the three Iris species in the classic Fisher dataset, using color-coded circles with a corresponding legend. The visualization is rendered as an SVG using D3 v7 (v7.8.5), with linear scales, axes, and ticks generated via `scaleLinear`, `axisBottom`, and `axisLeft`. Data is loaded from a local CSV file, and each point’s position maps to the measured values. The plot includes grid lines, axes labels, and a title, with circles colored by species using `scaleOrdinal`.
AI-generated descriptionMIT Licensed





Comments
Sign in to join the discussion.