🌍 Public
Try this dataviz or use data for react native
VVikil Lakkavatri
Last edited Jan 3, 2023
Created on Jan 3, 2023
Forked from Daily new cases of Covid in Italy - Scatter Plot
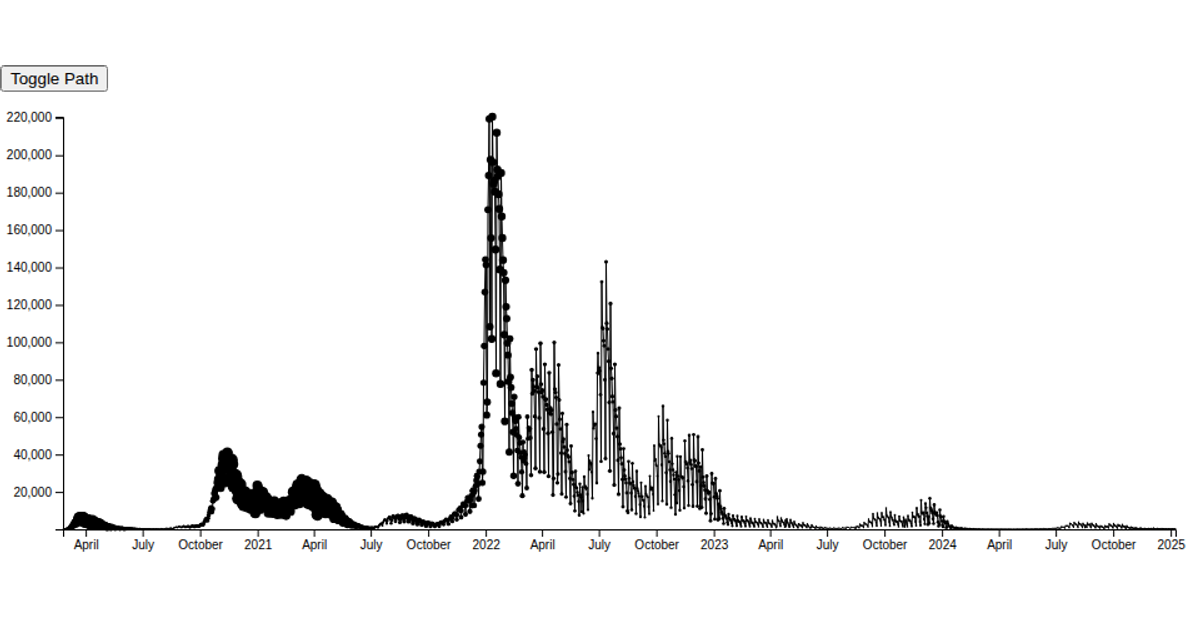
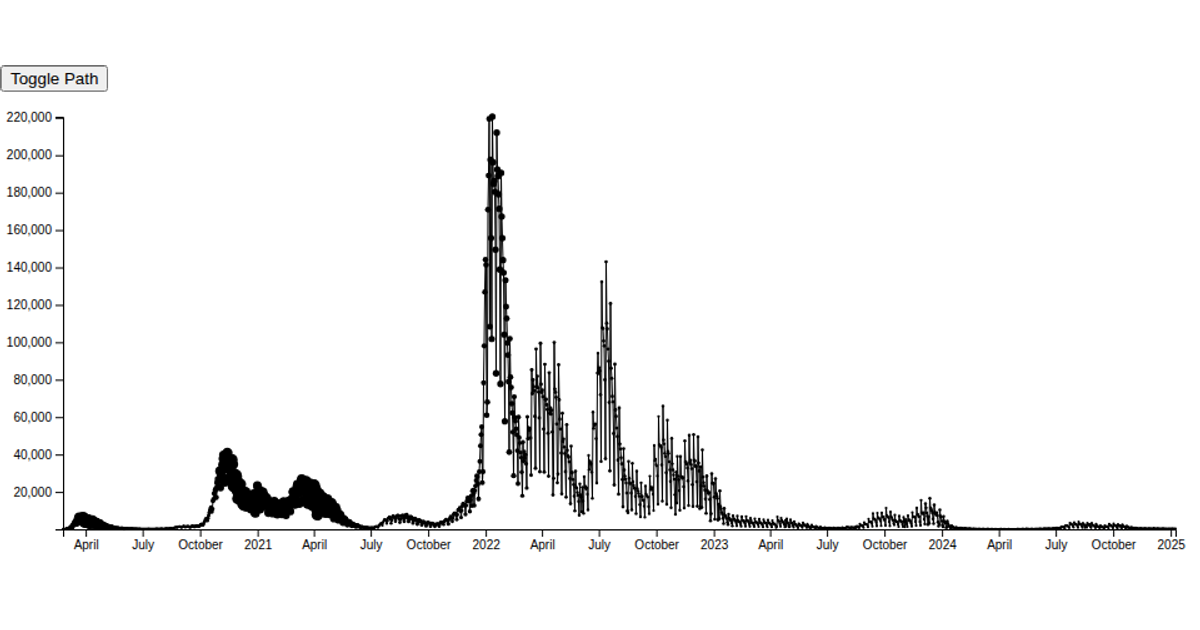
This scatterplot visualizes the daily new COVID-19 cases in Italy, with point radius proportional to the number of intensive care patients. The x-axis uses `scaleTime` for dates, while `scaleSqrt` maps intensive care counts to point sizes. A button toggles a path drawn with `line()`. The code leverages D3 v6's `csv` parser, `scaleLinear`, `extent`, and `axisLeft`/`axisBottom` APIs. Data comes from a continuously updated GitHub repository containing national pandemic statistics, rendered as SVG within a React framework.
AI-generated descriptionCovid pandemic in Italy
This scatterplot shows the time series of daily new cases of Covid in Italy.
- x-axis exploits
scaleTime - the radius of points is proportional (i.e.,
scaleLinear) to the amount of patients in intensive care on a daily basis - use the button in the top-left corner to toggle the path
- Data source (continuously updated)
MIT Licensed





Comments
Sign in to join the discussion.