🌍 Public
world map with points
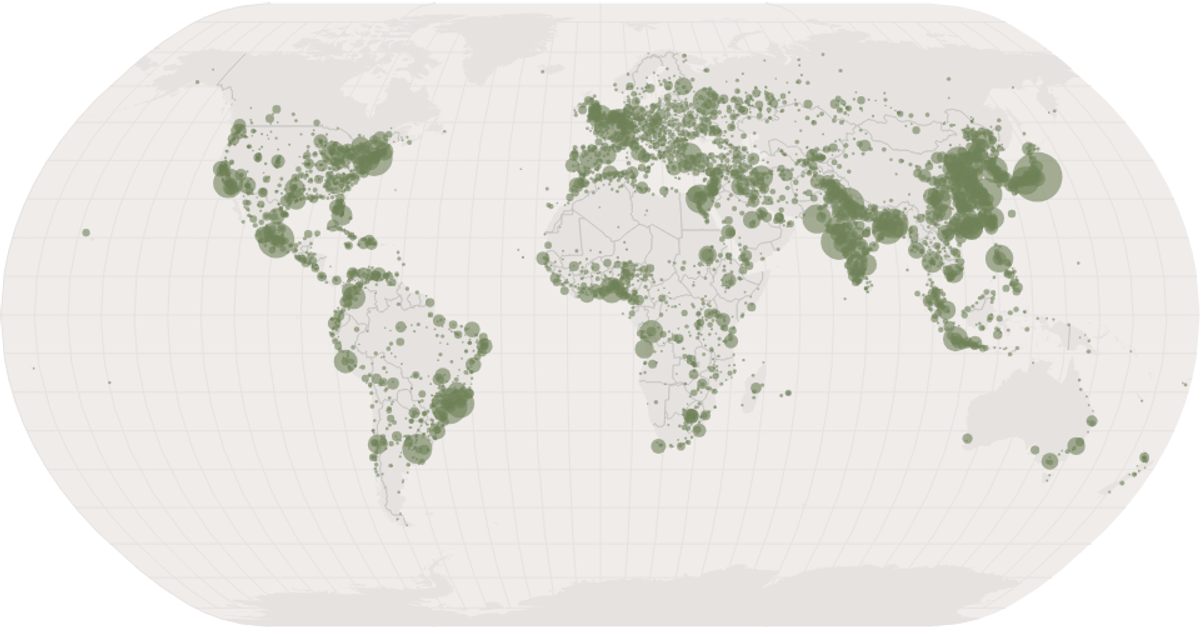
This example visualizes global population distribution using a natural Earth projection, plotting cities as semi-transparent circles sized by population. The map renders SVG paths for land, graticules, and sphere outlines via `d3.geoPath`, while React hooks load world atlas TopoJSON and city CSV data, with `d3.scaleSqrt` mapping population to circle radii.
AI-generated descriptionscatter plot with react and d3
[Data (https://gist.github.com/curran/a08a1080b88344b0c8a7).
MIT Licensed


Comments
Sign in to join the discussion.