🌍 Public
ice8_task2A
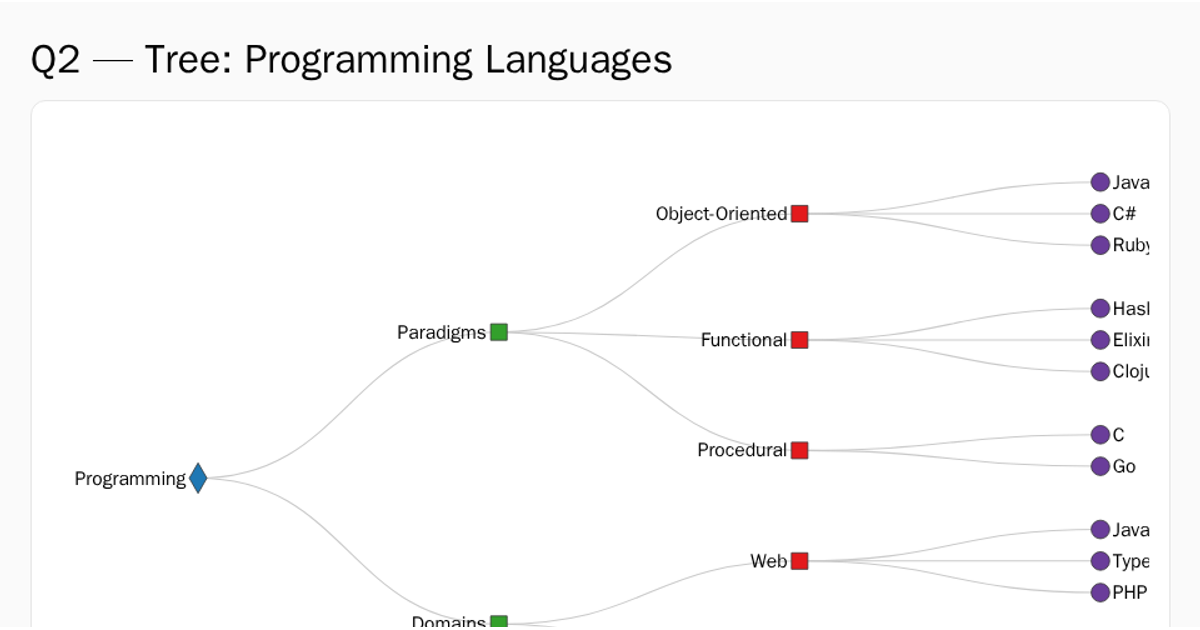
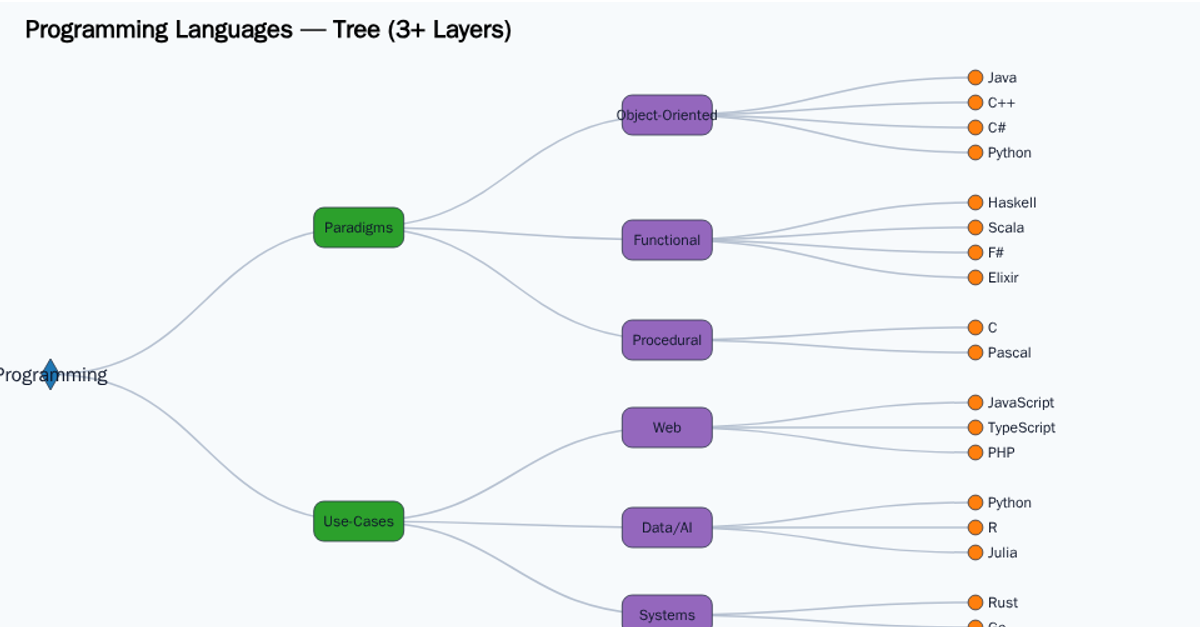
This interactive tree diagram visualizes programming paradigms, categorizing languages into functional, object-oriented, logic, and procedural groups. The visualization uses a hierarchical layout with custom node shapes and colors for each depth level. The chart is rendered in SVG using d3.v7, employing the `d3.tree` layout algorithm with horizontal links. Node colors are assigned using `d3.scaleOrdinal` with distinct palette ranges, and text labels display each paradigm and language name. The data structure is hardcoded in the source file.
AI-generated descriptionMIT Licensed





Comments
Sign in to join the discussion.