🌍 Public
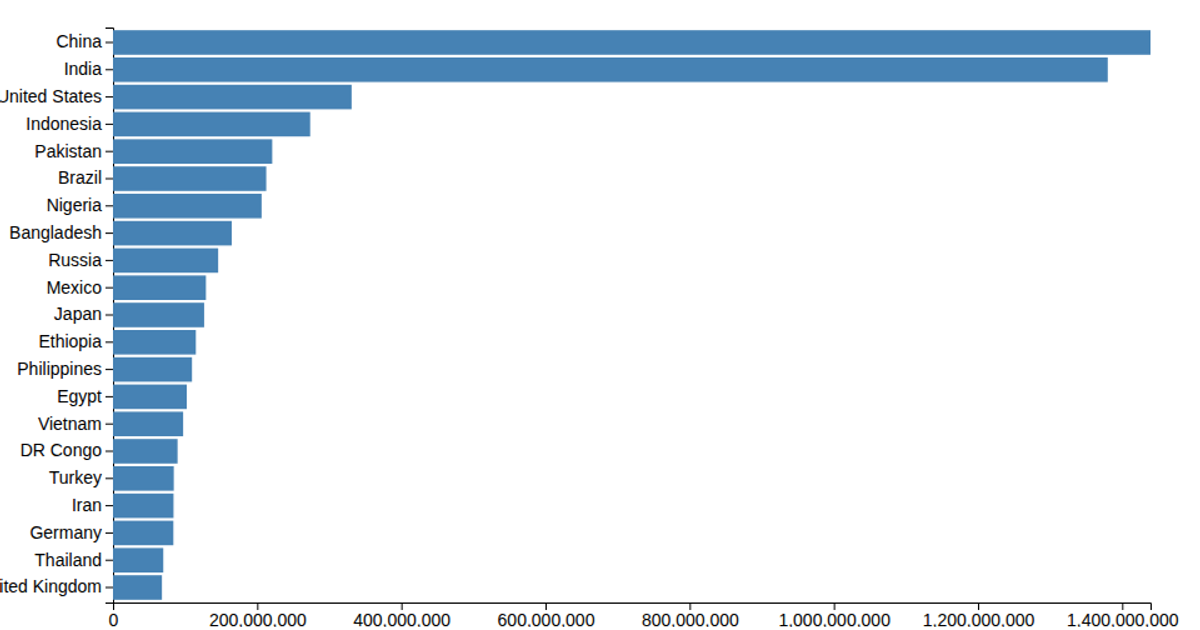
Making a bar chart
A horizontal bar chart ranks social media platforms by user count, using Font Awesome icons instead of text labels for each bar's category. The visualization loads data from a CSV file and renders SVG rectangles with D3 v5's `scaleLinear`, `scaleBand`, `csv`, `axisLeft`, and `max`. The bars are filled with a red color, while the y-axis displays the platform names. The chart includes margins and uses a linear scale for the quantitative user values, with the x-axis hidden in the final output.
AI-generated descriptionMIT Licensed




Comments
Sign in to join the discussion.