🌍 Public
Fork of Curran's Stylized Scatter Plot
Rrichard.adamson@hotmail.com
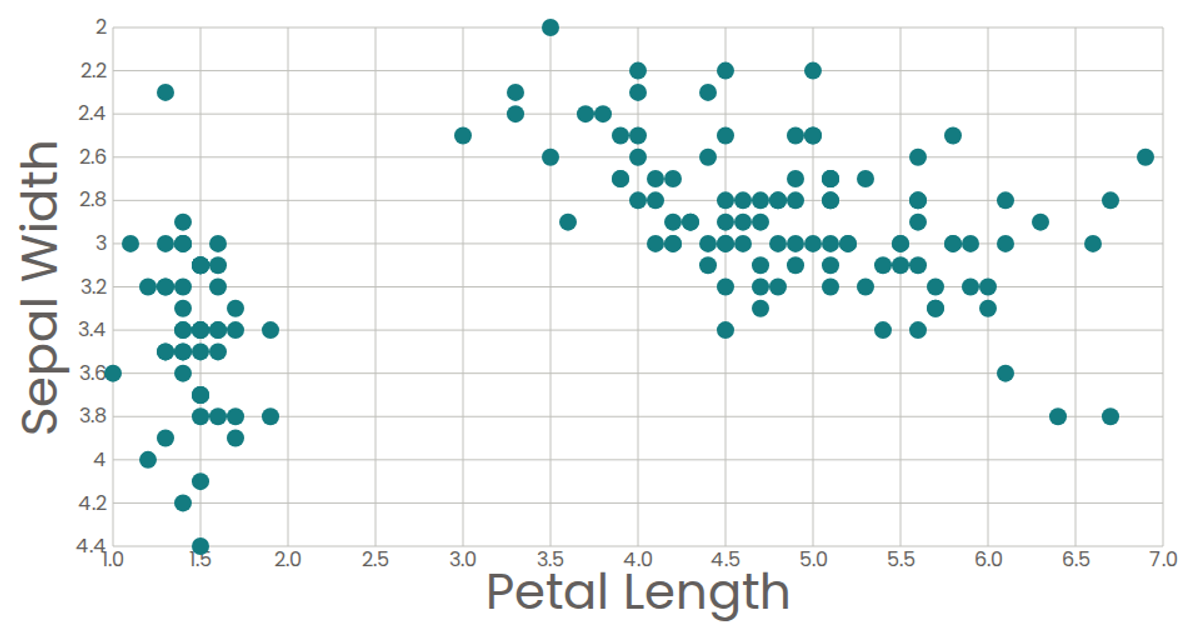
This scatter plot visualizes the Iris Dataset, plotting petal length against sepal width for individual iris flowers. The visualization uses React with D3 v5’s scaleLinear and extent functions to map data to SVG coordinates. It renders axis ticks, grid lines, and circles as marks, with tooltips displaying formatted values. The styling uses the Poppins font and a custom color scheme, and the chart is presented within an SVG canvas.
AI-generated descriptionA scatter plot of The Iris Dataset.
MIT Licensed


Comments
Sign in to join the discussion.