World Happiness Scatter Plot
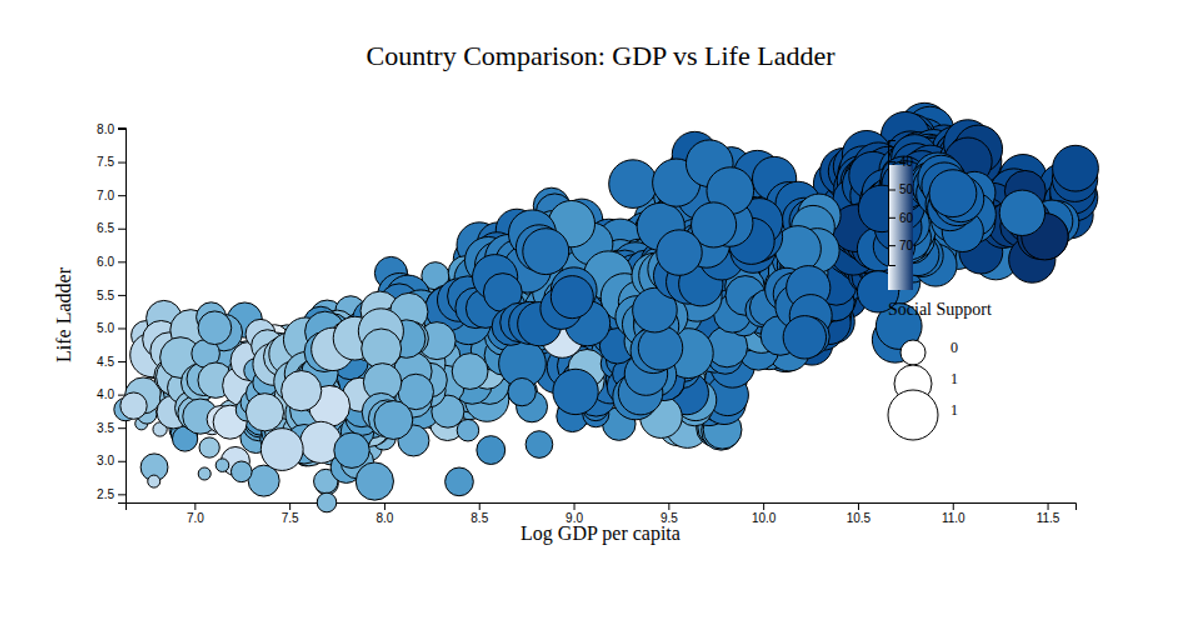
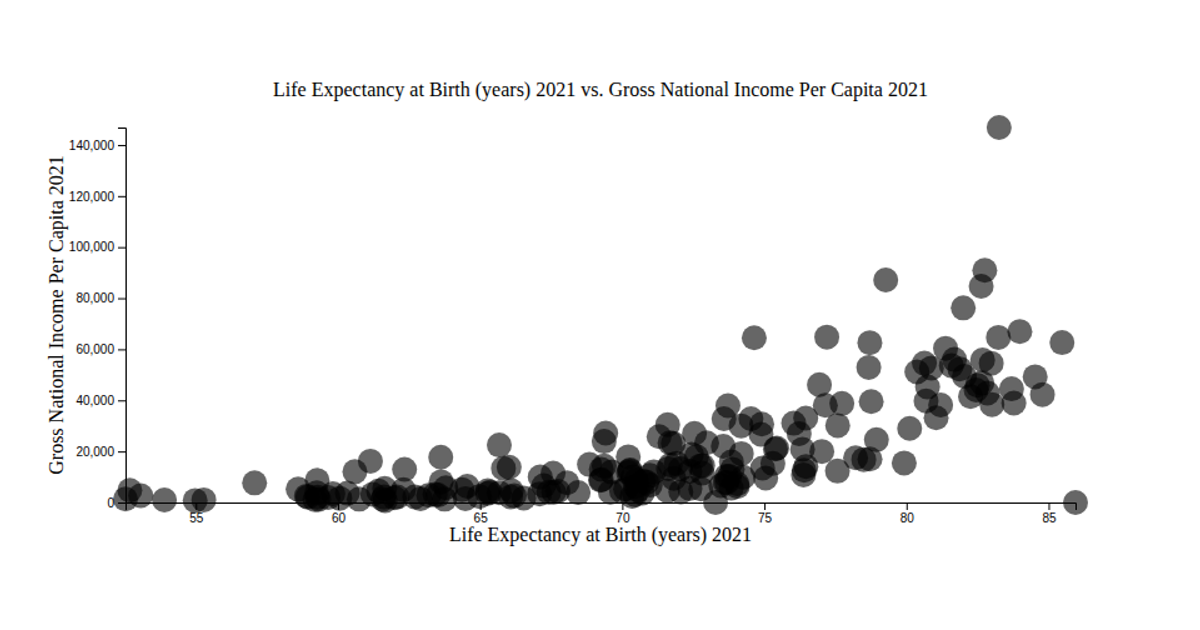
This scatter plot shows the relationship between GDP per capita and healthy life expectancy across countries, revealing a positive correlation. The visualization uses d3.scaleLinear to map data dimensions to positions and d3.axisLeft for the y-axis. Data comes from the @mjmacgregor/worldhappiness package, rendered as semi-transparent circles on a gray background. The code employs axis label utilities from @curran/axis-labels to annotate both axes. This chart effectively demonstrates how wealthier nations tend to have higher life expectancy.
AI-generated descriptionA simple scatter plot of my World Happiness dataset
This scatter plot visualizes the correlation between a country's healthy life expectancy and GDP per capita. This scatter plot suggests that there is a positive relationship between a country's life expectancy and GDP!






Comments
Sign in to join the discussion.