🌍 Public
Fork of Making a bar chart 2!
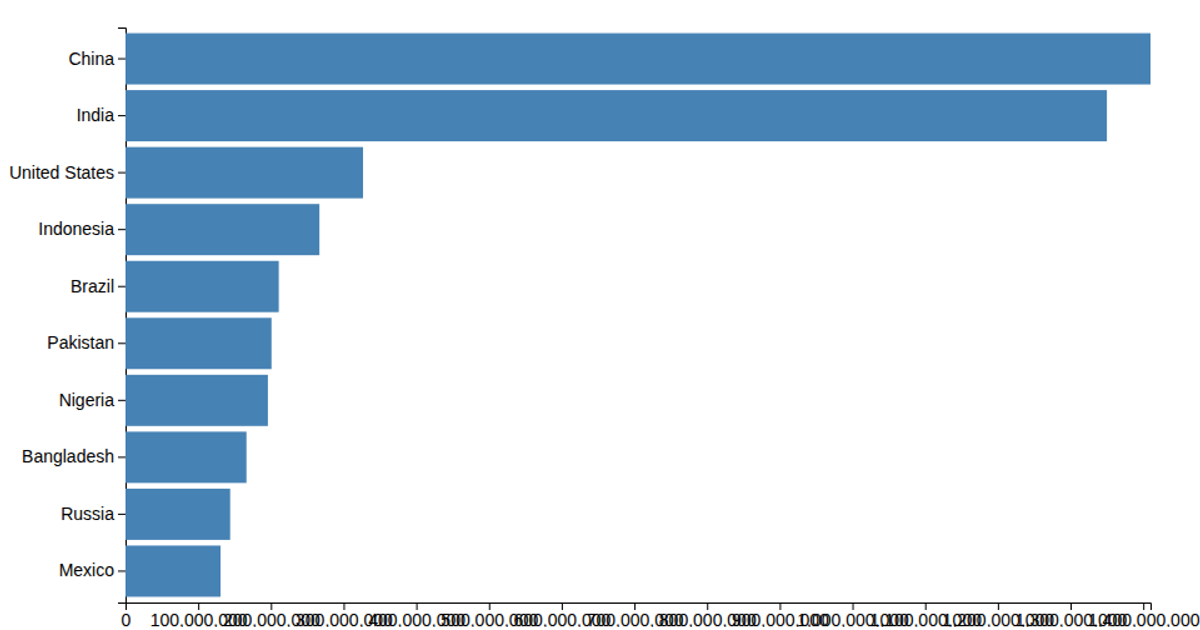
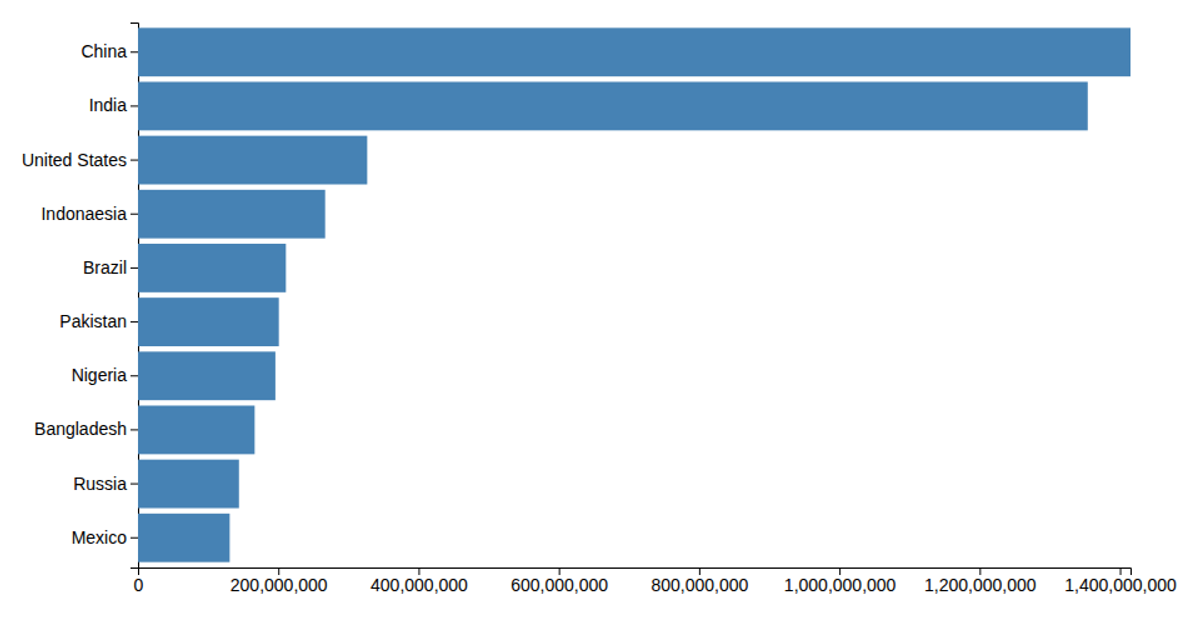
This chart displays the populations of the ten most populous countries using horizontal bars. It loads data from a CSV file, converts population values, and scales them with `d3.scaleLinear` while positioning countries via `d3.scaleBand`. The SVG rendering includes axes from `d3.axisBottom` and `d3.axisLeft`, with formatted tick labels and a title. Styling via external CSS sets bar color, tick text, and label sizes.
AI-generated descriptionMIT Licensed




Comments
Sign in to join the discussion.