🌍 Public
Activity-VII-Q1(11713131)
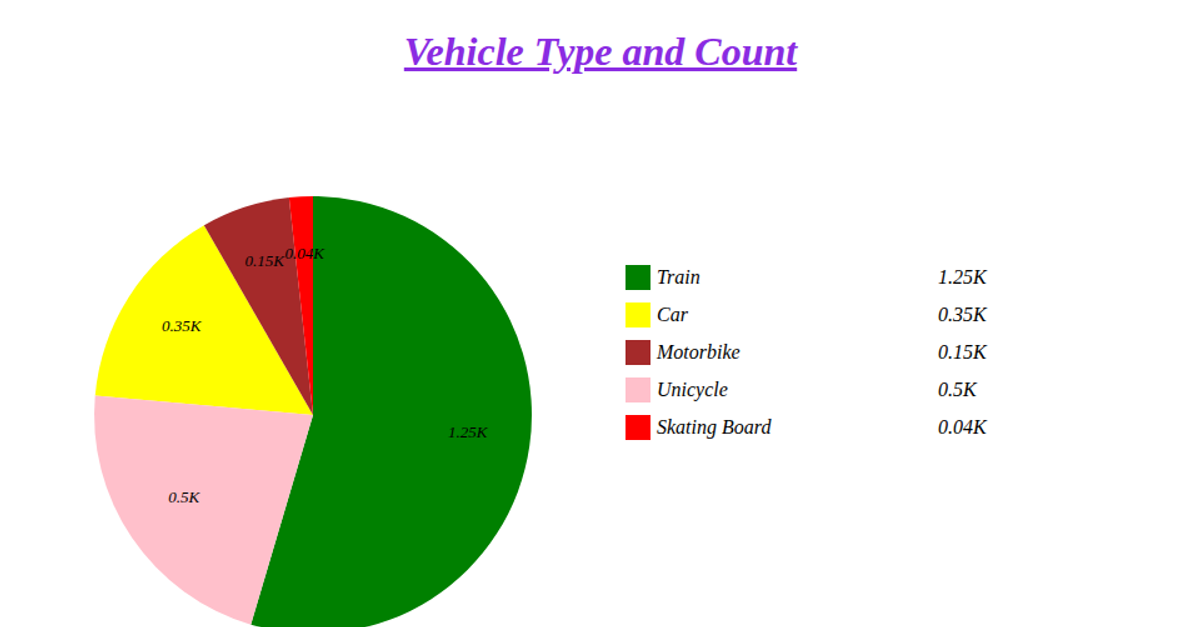
This pie chart visualizes the distribution of car origins from the `mpg.csv` dataset. It counts occurrences of each unique value in the 'origin' column and displays them as proportional slices using Chart.js on an HTML5 Canvas. The code fetches the remote CSV, splits it into rows, and tallies origin frequencies before rendering with semi-transparent colors and a title plugin. The chart is static, with a fixed 400x400 pixel canvas and no interactive features.
AI-generated descriptionMIT Licensed




Comments
Sign in to join the discussion.