🌍 Public
Fork of line chart section 3
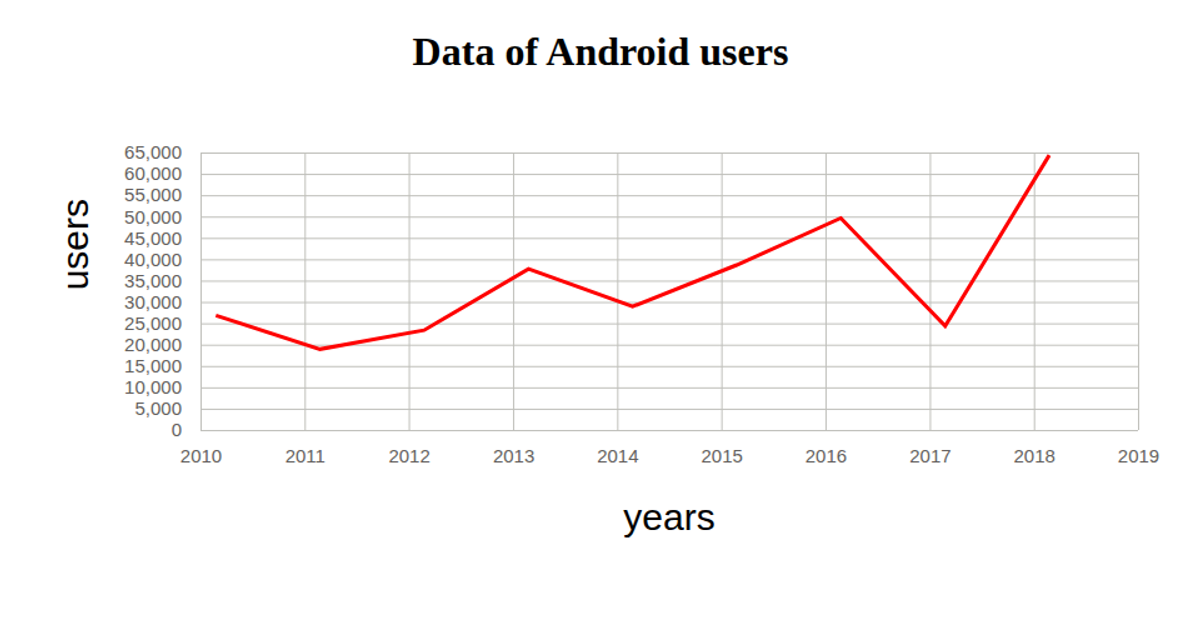
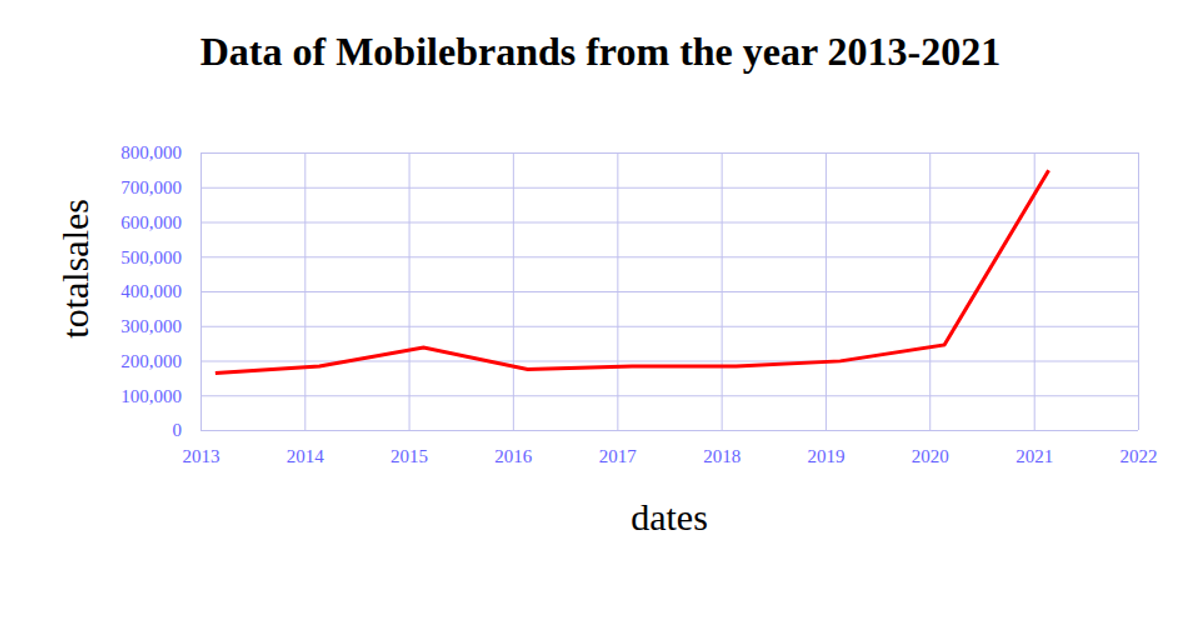
This chart displays the number of smartphone users from 2010 to 2021 as a single blue line, with red tick labels and green gridlines. It loads CSV data from a GitHub gist and uses d3.csv, d3.scaleTime, d3.scaleLinear, d3.axisBottom, d3.axisLeft, and d3.line to render the SVG graphic. The data is parsed with d3.timeParse for the year and numeric conversion for user counts, with margins and axis labels formatted via CSS.
AI-generated descriptionMIT Licensed


Comments
Sign in to join the discussion.