🌍 Public
Menu
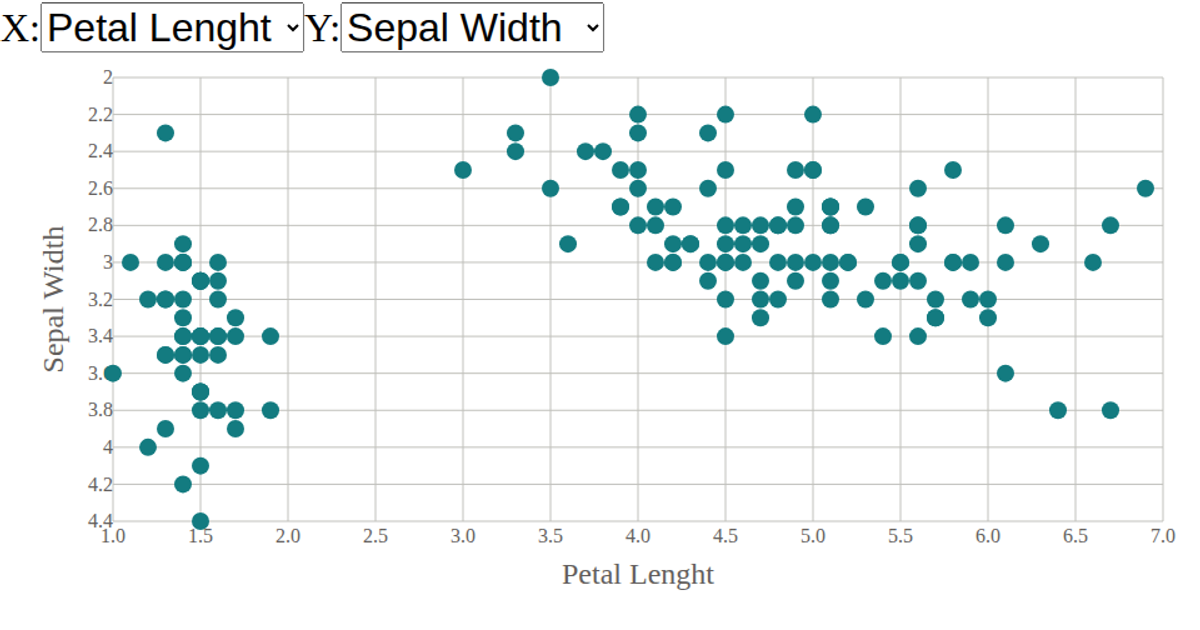
This interactive scatter plot visualizes the Iris dataset, showing how flower measurements relate to species. Menus let users switch which numeric variables appear on the x- and y-axes. React manages the dropdown state and passes selections to reusable D3 scale components. The SVG chart uses d3.scaleLinear for axes and d3.extent to set domains, while d3.csv loads and parses the data.
AI-generated descriptionA scatter plot of The Iris Dataset
MIT Licensed




Comments
Sign in to join the discussion.