🌍 Public
Fork of Missing Migrants on a Map
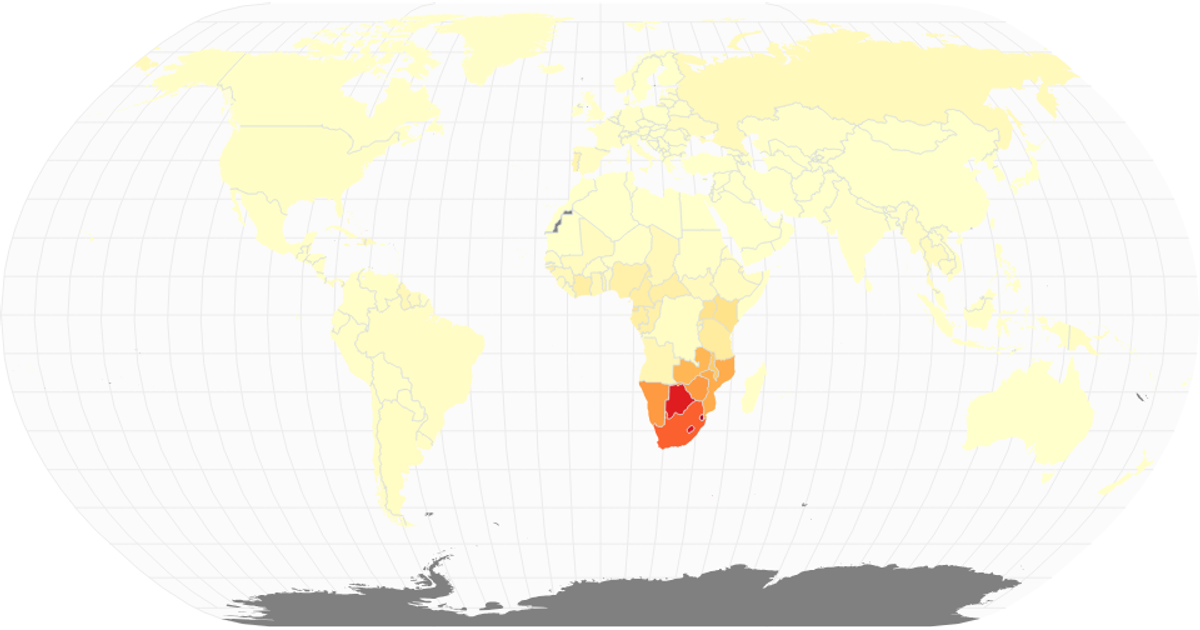
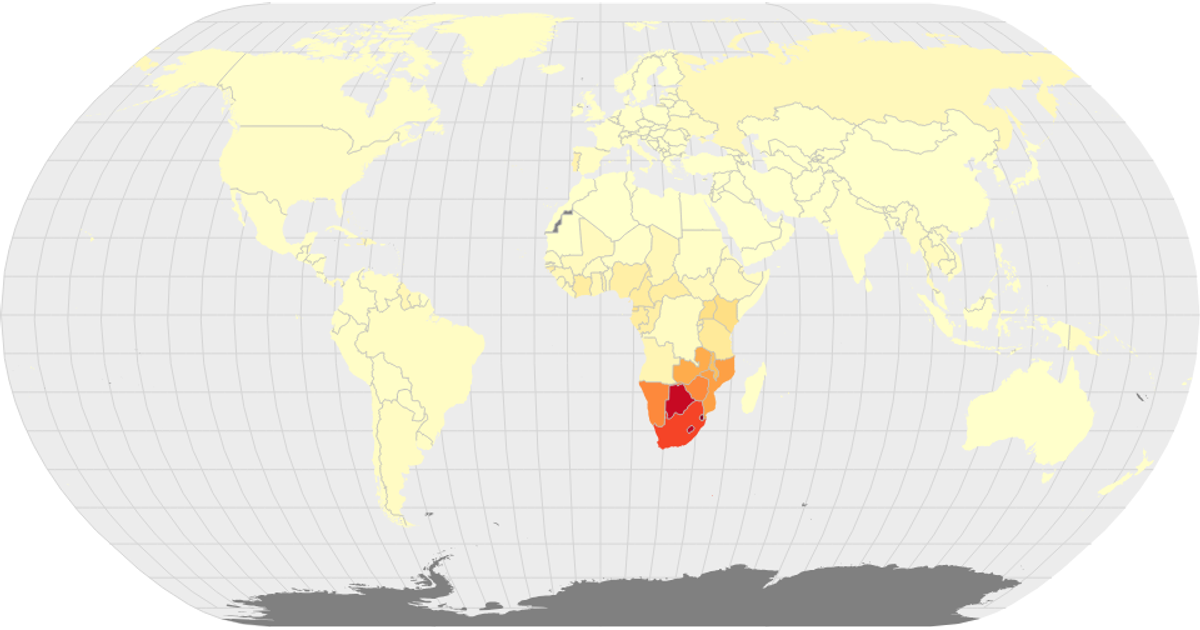
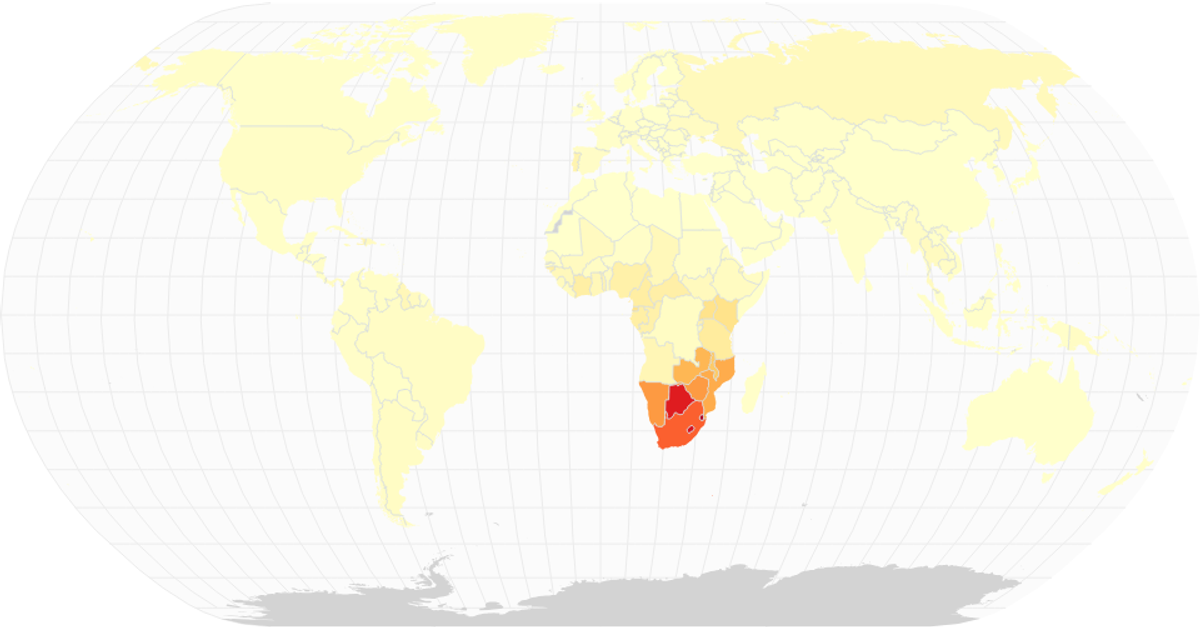
This choropleth map visualizes the share of the population infected with HIV by country for a selected year, using a sequential color scale (interpolateYlOrRd) to encode prevalence. Drawing with d3.geoPath, the map renders country boundaries from World Atlas TopoJSON and overlays graticules and a sphere backdrop. Built with React and D3 v5, the visualization filters the Missing Migrants Dataset to a specific year and applies color mapping through scaleSequential, with opacity-controlled circles representing individual events.
AI-generated descriptionA world map of the Missing Migrants Dataset.
Each point in the plot represents a single event.
Country boundaries from World Atlas TopoJSON.
MIT Licensed



Comments
Sign in to join the discussion.