🌍 Public
Baby Diaper pattern
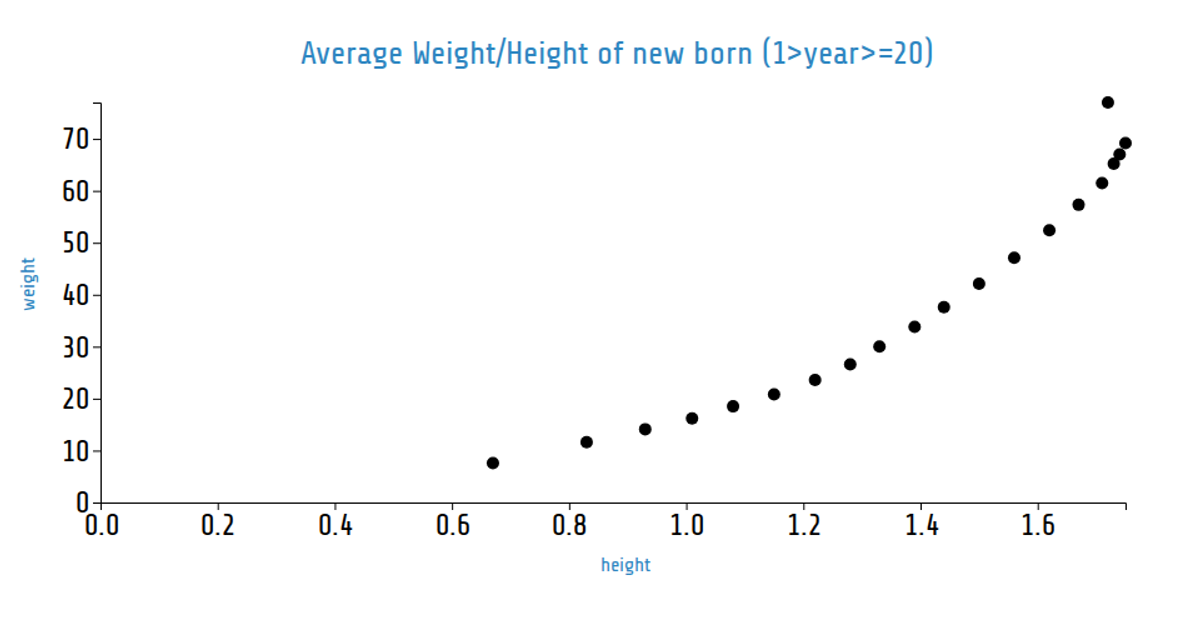
This scatter plot visualizes the diaper-change pattern of a baby over time, distinguishing between wet, bowel movement (BM), and combined BM+Wet statuses, with points marked red when the diaper leaked. The x-axis and y-axis labels in the code reference "Horsepower" and "Weight," indicating the visualization reuses a generic car-dataset template rather than being fully customized to the diaper data. Built with D3 v5, the example uses `scaleLinear`, `axisBottom`, and `axisLeft` to render the SVG axes and circles, with the dataset loaded from `data.csv` via `d3.csv`.
AI-generated descriptionThis scatter plot shows data about baby diaper pattern
MIT Licensed





Comments
Sign in to join the discussion.