🌍 Public
The Increasing Global Temperature
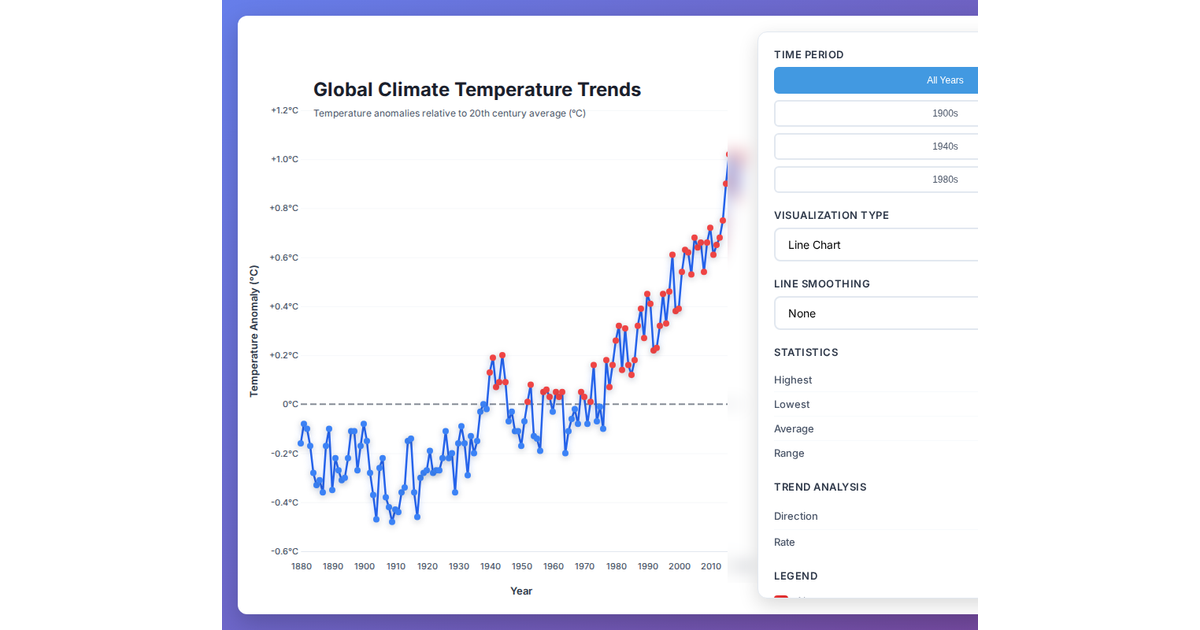
This example visualizes the increasing global temperature using a React-based application. It renders a simple chart with D3.js, presenting temperature data from NASA to show trends over time. The visualization is built with React for component structure and D3.js for chart generation, displaying the dataset in a clear, textual format. The code includes a README and starter files, with the main visualization logic implemented in JavaScript using ReactDOM to mount the app.
AI-generated descriptionReact Starter code.
MIT Licensed






Comments
Sign in to join the discussion.