🌍 Public
veda_ice5
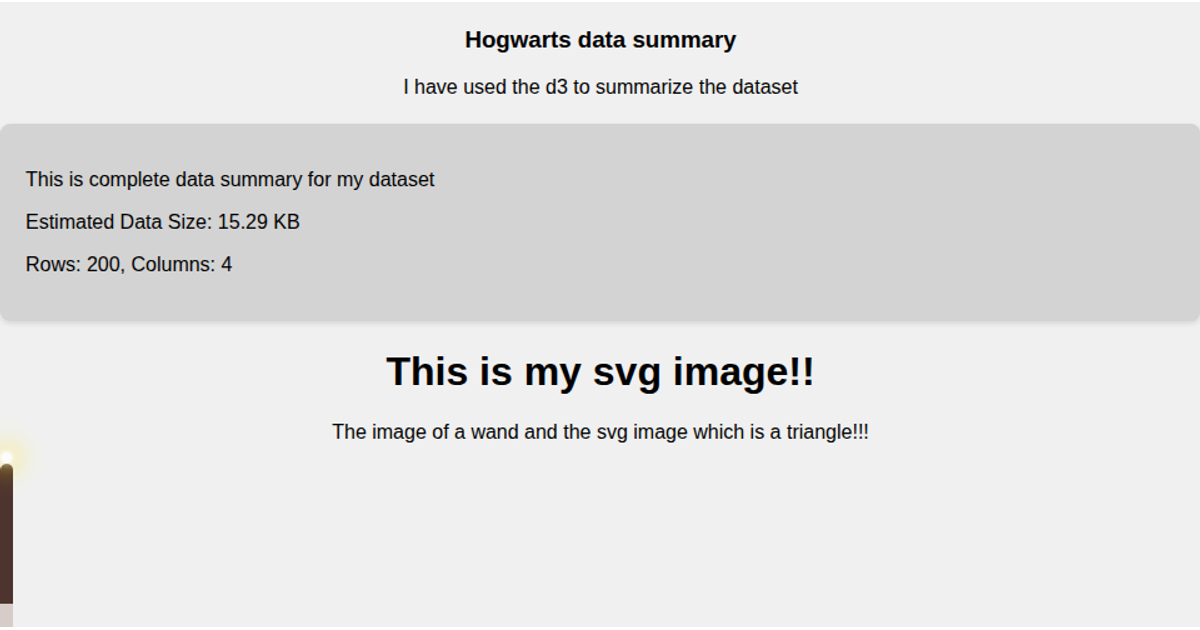
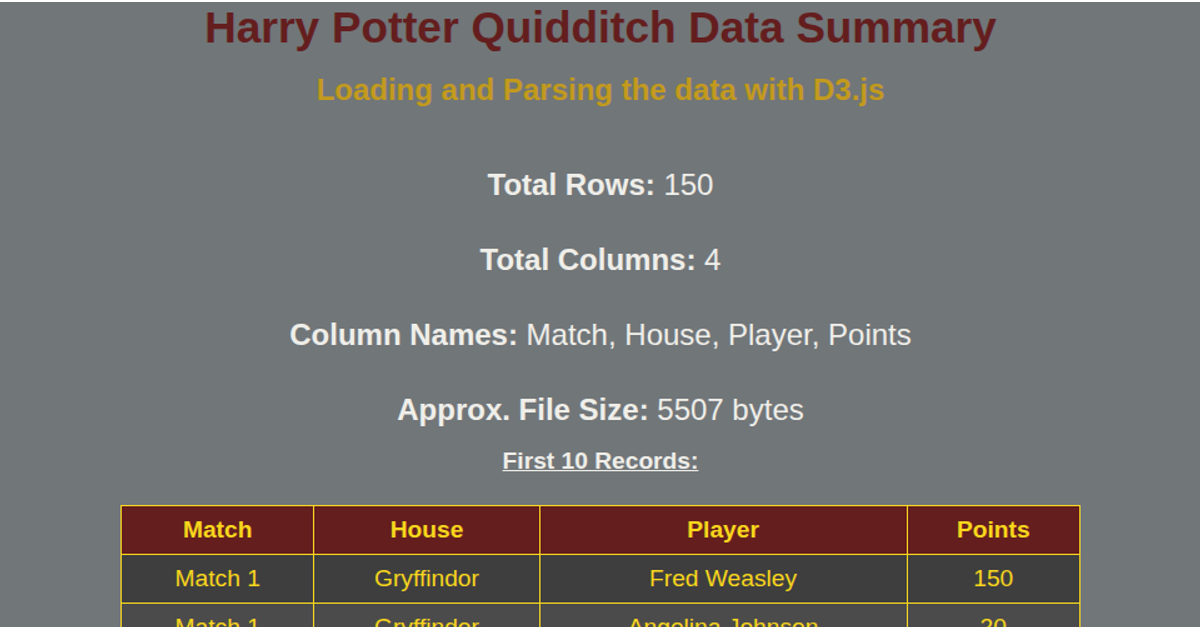
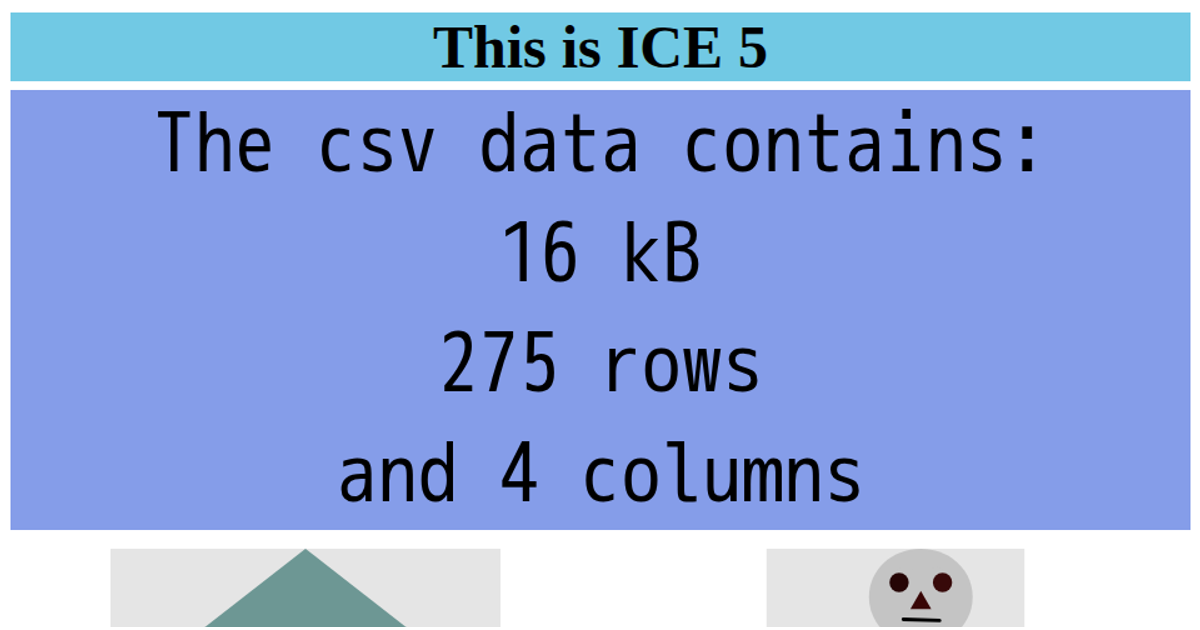
This example summarizes the Hogwarts dataset by displaying key statistics about the loaded CSV file, including row and column counts and estimated file size. It uses D3.js v7 to fetch the data from a remote GitHub repository and compute these metrics. The page also features a decorative wand with a sparkle animation and an embedded SVG triangle image, rendered with inline SVG markup. The visualization focuses on presenting a simple data summary alongside playful, Harry Potter-themed visual elements, all styled with custom CSS.
AI-generated descriptionMIT Licensed




Comments
Sign in to join the discussion.